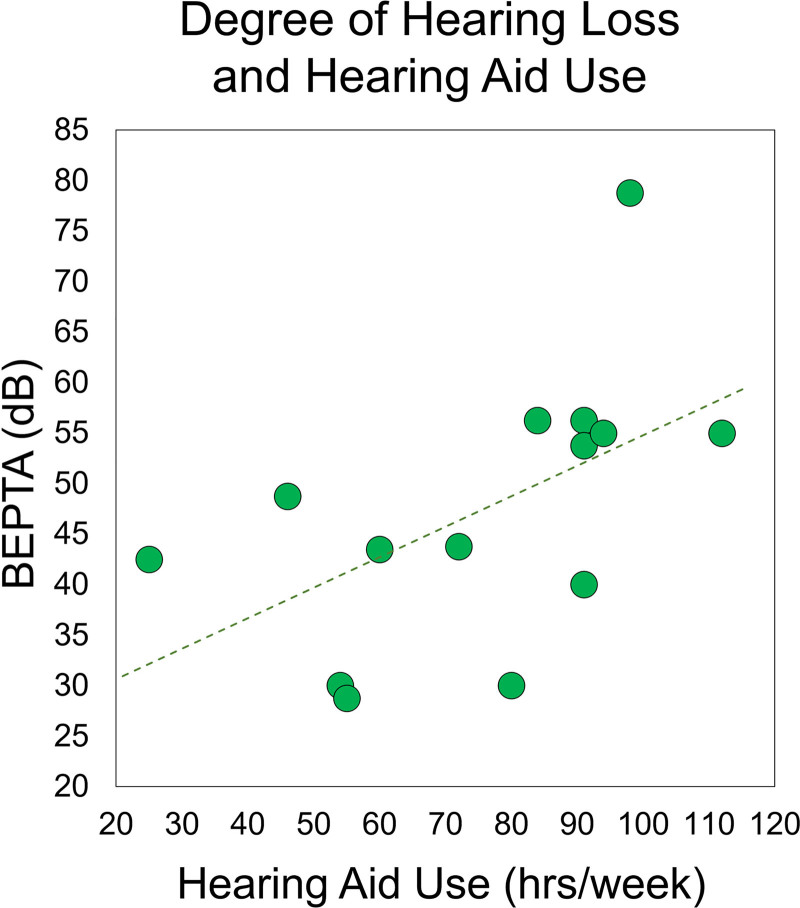
Fig. 2.
Relationship between BEPTA and hearing aid use. Degree of hearing loss (i.e., BEPTA, in dB) is shown on the y axis, while hearing aid use (in total number of hours per week) is denoted on the x axis. There was a significant correlation between degree of hearing loss and hearing aid use, such that participants with more severe hearing loss wore their hearing aids more often (p < 0.05). BEPTA, better-ear pure-tone average.

