FIGURE 1.
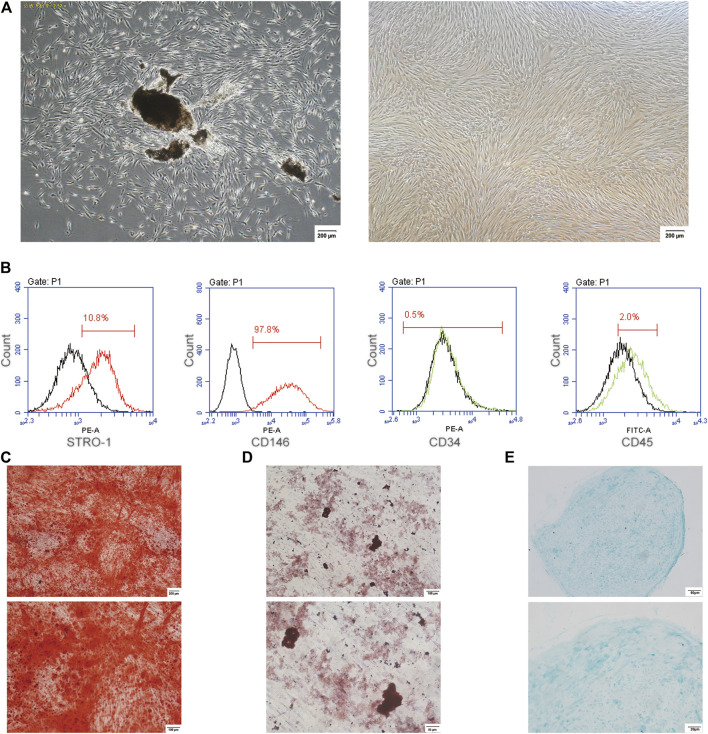
The culture and identification of PDLSCs. (A) The cultured PDLSCs, isolated from the human periodontal ligament tissues and passaged at 6, with a morphology of fusiform. The scale bars, 200 µm. (B) Flow cytometry data showed the positive expression for STRO-1 and CD146, and the negative expression for CD34 and CD45 in PDLSCs. (C) Alizarin red staining. The scale bars, 100 and 200 µm. (D) Oil red O staining. The scale bars, 50 and 100 µm. (E) Alcian blue staining. The scale bars, 20 and 50 µm.

