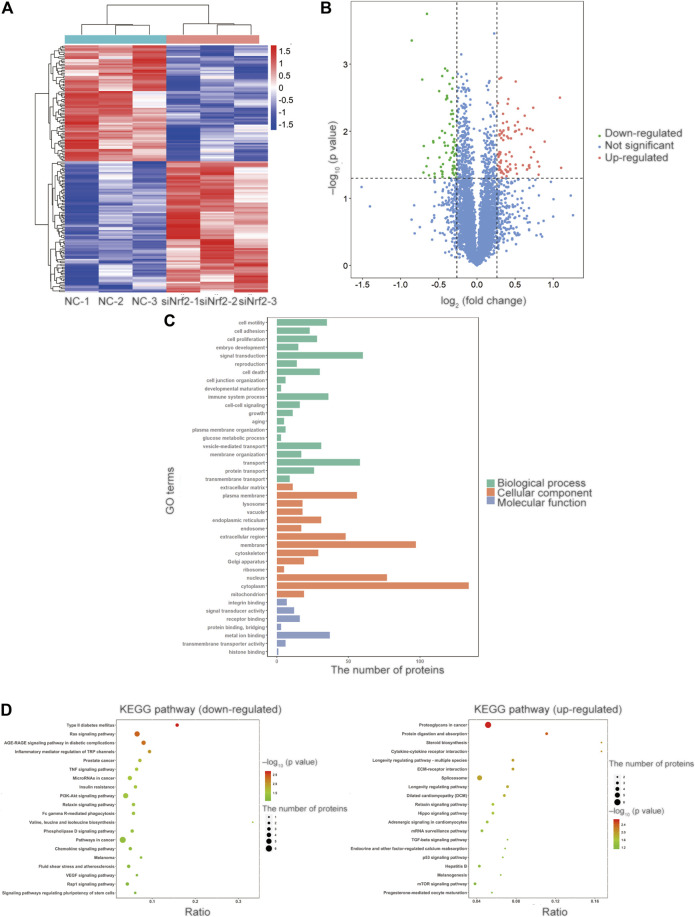
FIGURE 2.
Identification of the differentially expressed proteins and bioinformatics via TMT-based LC-MS/MS analysis. (A) The heatmap of the relative abundance of proteins in each sample. (B) The volcano plot showed 162 proteins were differentially expressed compared with the control proteins, including 76 downregulated and 86 upregulated proteins. The proteins with the p value less than 0.05 and the fold change more than 1.2 or less than 0.833 were selected and recognized as differentially expressed proteins for further study. The value of log2 (fold change) was set as abscissa, and the value of -log10 (p value) was set as the ordinate. (C) GO enrichment analysis revealed that the differentially expressed proteins were involved in the cellular component (CC) category, the biological process (BP) category and the molecular function (MF) category. (D) The KEGG pathway enrichment analysis of the up-regulated and down-regulated proteins.

