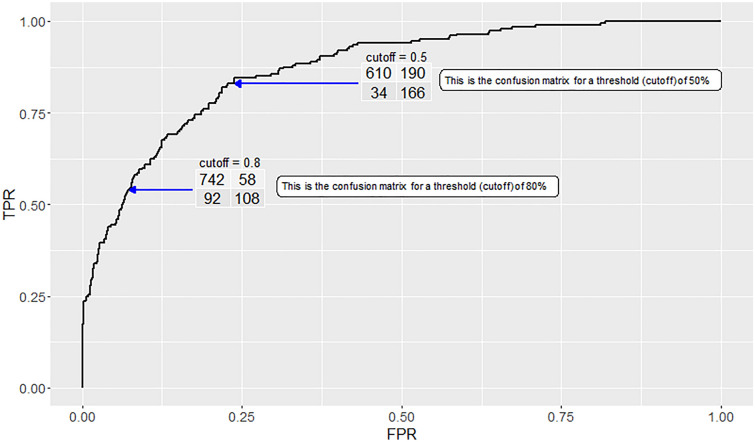
Fig. 1.
Example receiver-operator-characteristic curve for test data that are consistent with the algorithm being used by our clinician in the example. Two different thresholds, or cutoffs, are highlighted. At each, we display the resultant data in a confusion matrix. The 80% (0.8) threshold cutoff provides the closest appropriate data relevant for the output of the algorithm used in our clinical scenario. FPR False positive rate, TPR true positive rate

