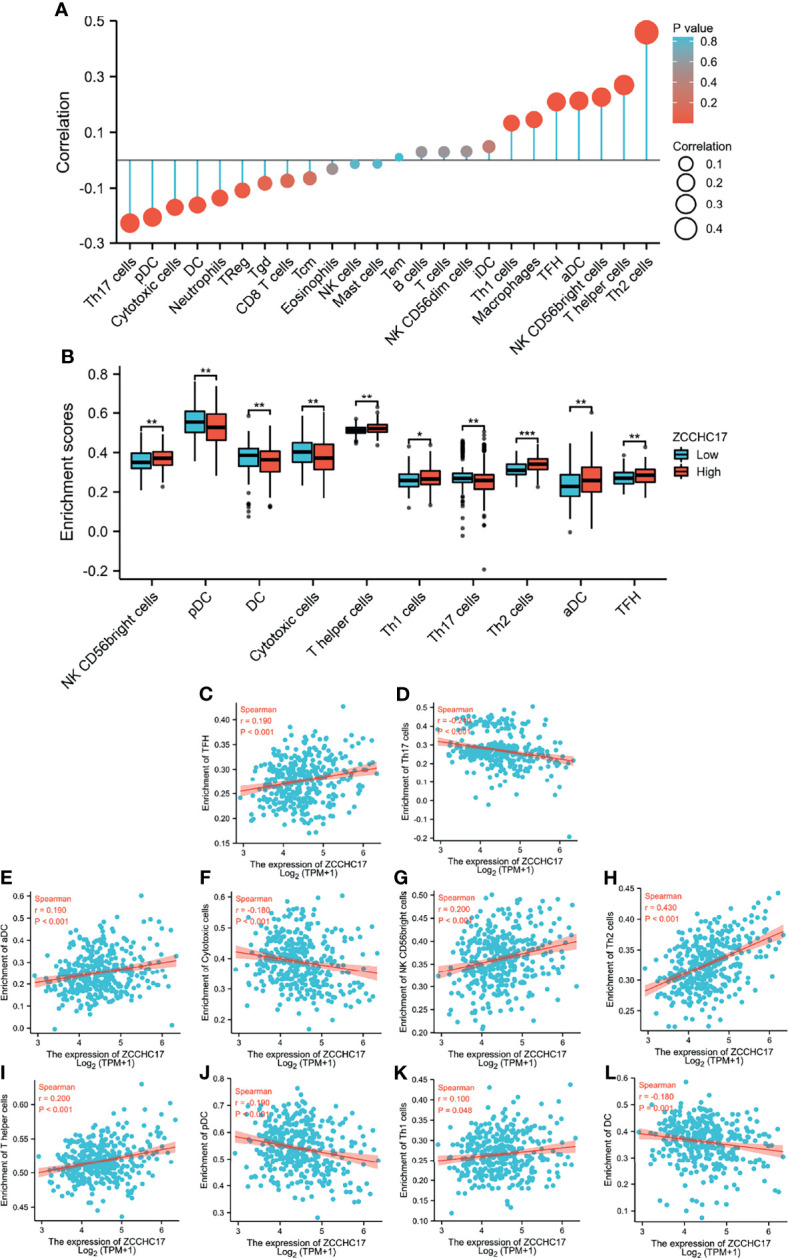
Figure 6.

The relationship between ZCCHC17 expression and immune cells infiltration in TCGA. (A) Lollipop diagram showing a correlation between ZCCHC17 and levels of 24 immune cell infiltrates; (B) 10 immune cells are differentially expressed in different groups of ZCCHC17 (P< 0.05); (C–L) Scatter plot showed the correlation between the infiltration of 10 immune cells and the ZCCHC17 expression (P <0.05). *P < 0.05; **P < 0.01; ***P < 0.001.
