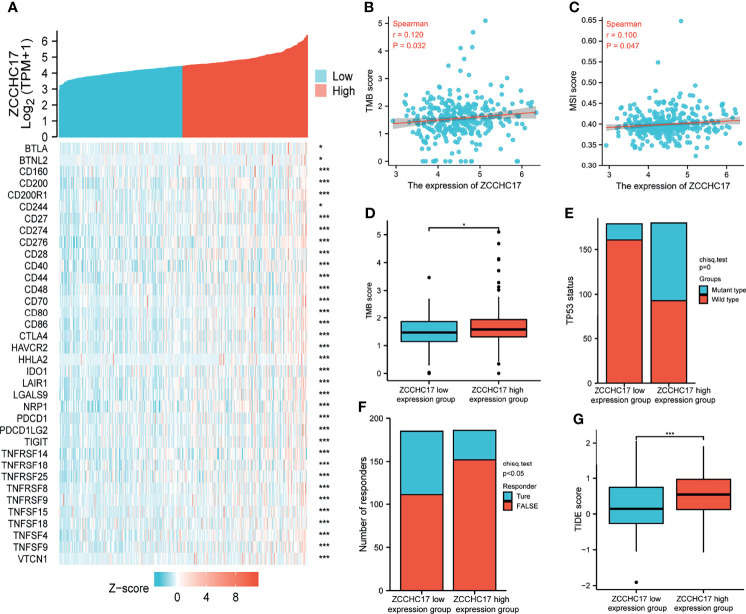
Figure 7.
Analysis of ZCCHC17 was used as a marker for immunotherapy. (A) Spearman correlation analysis of ZCCHC17 expression and immune checkpoint genes expression; (B) Spearman correlation analysis of TMB and ZCCH17 gene expression (r=0.120, P =0.032); (C) Spearman correlation analysis of MSI and ZCCH17 gene expression (r=0.100, P =0.047); (D) Difference analysis of TMB in different groups of samples of HCC patients (P <0.05); (E) Distribution of TP53 gene mutation status in HCC patients in different groups of samples (P <0.001); (F) The distribution of immune responses of samples in different groups in the prediction results (P <0.05); (G) The distribution of immune response scores in different groups in the prediction results (P <0.001). *P < 0.05; ***P < 0.001.

