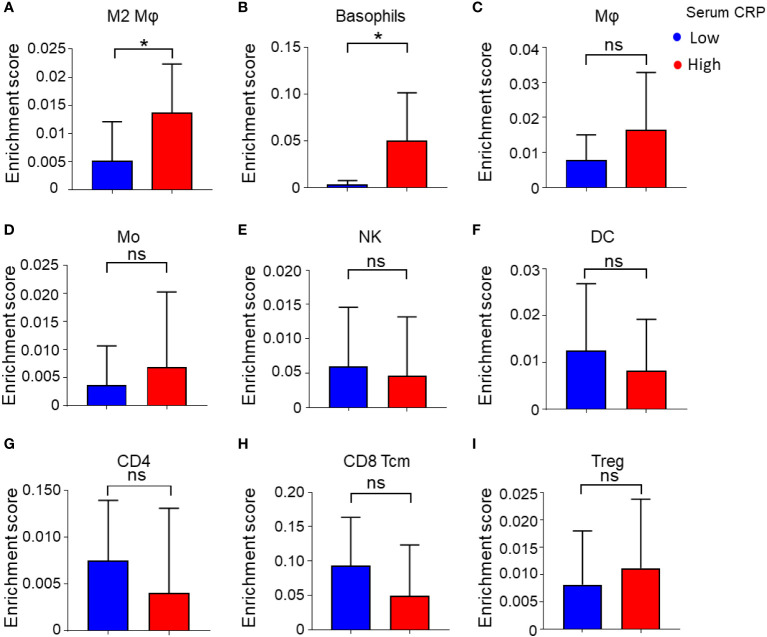
Figure 4.
Enrichment score of 34 immune cell subtypes calculated by xCell. (A–I) Immune cell enrichment score of M2 Mφs (A), basophils (B), Mφs (C), monocytes (Mo) (D), NK cells (E), DCs (F), CD4+ T cells (G), CD8+ central memory T cells (Tcm) (H), Tregs (I), and between low and high serum CRP level groups. Student’s t tests were applied, and *P < 0.05. ns, not significant.

