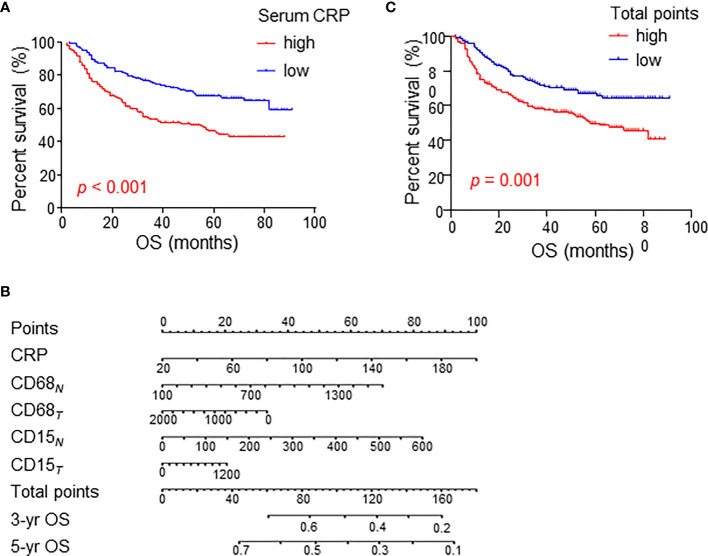
Figure 6.
Cumulative overall survival curves of HCC patients grouped based on CRP levels and TAM/TAN densities in the NT or IT region. (A) Overall survival (OS) of HCC patients divided by serum CRP levels. (B) A nomogram to predict prognosis of HCC patients. (C) OS of HCC patients divided by total points of nomogram. OS was estimated using the Kaplan–Meier method and compared using the log-rank test. .

