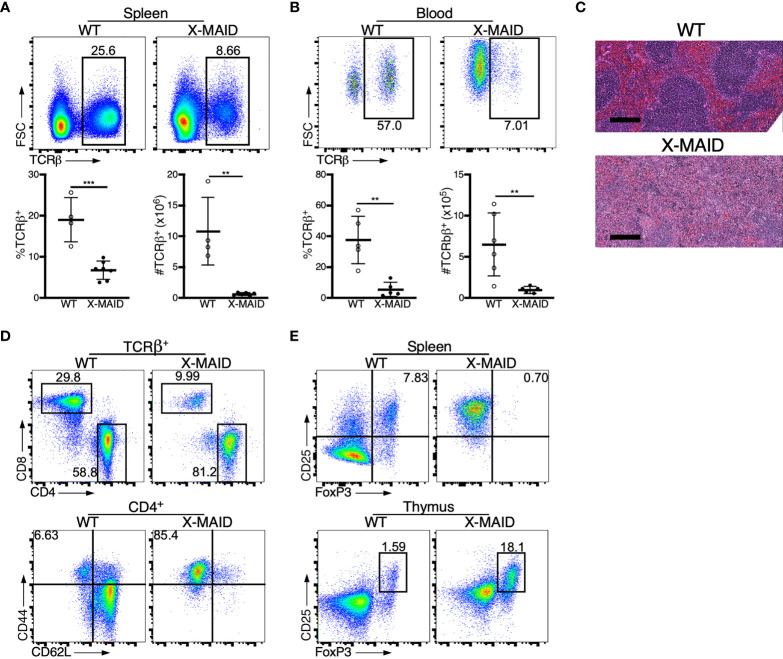
Figure 2.
Dysregulation of T cell populations in peripheral lymphoid organs of X-MAID mice. WT or X-MAID male mice were sacrificed at 3-5 weeks old, and the indicated tissues were harvested for analysis. (A, B) Using flow cytometry, gated on live single cells, the proportion and absolute number of TCR β+ cells were determined from (A) spleen or (B) blood. (C) H&E staining from spleen sections shows a loss of follicle structure. Scale bars = 200μm. (D) Representative flow plots of CD4+ and CD8+ T cell subsets gated on TCR β+ live single cells from the spleens of WT or X-MAID mice (top). Further analysis of CD44 and CD62L expression on CD4+ T cells reveals elevated activation status (bottom). (E) CD25+FoxP3+ cells from the spleen (top) or thymus (bottom) of WT or X-MAID male mice gated on CD4 SP live single cells. Data in C-E are representative of results from at least 6 individual mice. Data in (A, B) represent means ± StDev, with each point representing an individual mouse. Statistics were calculated using a Student’s t test, **p < 0.01, ***p < 0.005.

