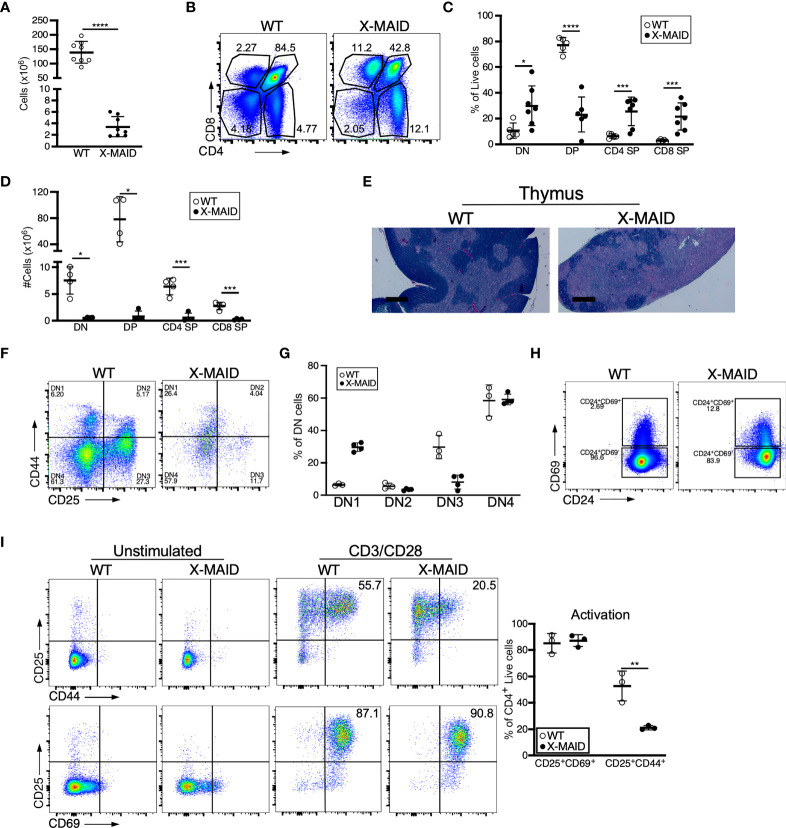
Figure 3.
Thymocyte numbers are reduced in X-MAID mice, but development and activation are grossly normal. Thymi from 3-4 week-old WT or X-MAID male mice were harvested and single cell suspensions were generated. (A) Total thymocyte number (B) Representative flow plots of thymocyte populations, gated on live single cells. Proportions (C) and absolute numbers (D) of thymocyte subsets were quantified, with each point representing an individual mouse. (E) H&E staining of the thymi from WT and X-MAID mice (representative of 4 mice for each genotype). Scale bars = 400μm. (F) Representative flow plots of thymocytes prepared as in A-C stained with CD44 and CD25 and gated on the CD4–CD8– (DN) live population. (G) The proportion of each DN population (DN1-DN4) is quantified with each point representing an individual mouse. (H) Representative flow plots of thymocytes prepared as in A-C stained with CD69 and CD24 gated on CD4+CD8+ live population. (I) CD4 SP Thymocytes from WT or X-MAID male mice were left unstimulated or stimulated overnight with CD3/CD28 and stained for CD25, CD69, and CD44. Representative plots are gated on CD4 SP live single cells (left) and the proportion of activated cells was quantified (right). Representative of 3 independent experiments. Data in (A, C, D, G, I) represent means ± StDev. Statistics were calculated using a Student’s t test, * p< 0.05, **p < 0.01, ***p < 0.005, ****p < 0.001.

