Figure 7.

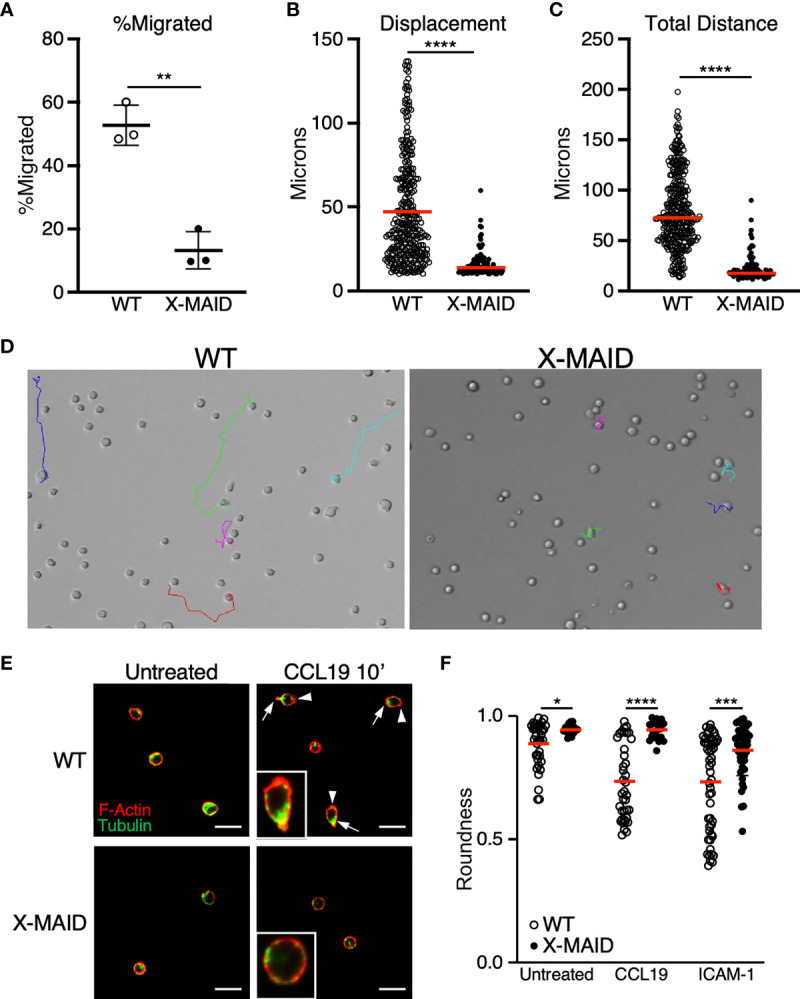
Reduced migratory capability is associated with lack of polarization in X-MAID T cells. (A–D) WT or X-MAID CD4 SP thymocytes were placed on ICAM-1 coated glass surfaces and imaged live using DIC optics every 30 seconds for 10 minutes. Cells were tracked using the manual tracking plugin on ImageJ. (A) % migrated was calculated as any cell moving more than 10μm and remaining in view for the entirety of the movie. Each point represents a field of at least 100 cells. Data represent means ± StDev. (B) Displacement and (C) Total distance traveled were calculated from first frame to final frame. (D) Representative images of the final frame with colored tracks from individual cells. (E) CD4 SP thymocytes were left untreated or stimulated with 100ng/ml CCL19 for 10 minutes, then fixed to a poly-L coated surface and stained for F-actin and tubulin to visualize actin leading edge (arrowheads) and tubulin-rich uropods (arrows). Representative images are shown for each condition, insets show higher magnification views of typical cells. Scale bars = 20μm (F) Images like those in (D, E) were used to measure roundness of cells using ImageJ software as detailed in the Materials and Methods. Means ± StDev are shown. (A–D) show data from one experiment (performed using cells pooled from 3-5 mice). This experiment was done twice with separate pools of mice, with similar outcomes. The data in (E, F) are pooled from two separate experiments done on different days, with each experiment using cells pooled from 3-5 mice. Data from the two experiments were in agreement, so were pooled for presentation. In (A), each point represents one field of cells; In (B, C, F) each point represents a single cell. Red bars in (B, C, F) represent means. Statistics for all panels were calculated using a Student’s t test, *p < 0.05, **p < 0.01, ***p < 0.005, ****p < 0.001.
