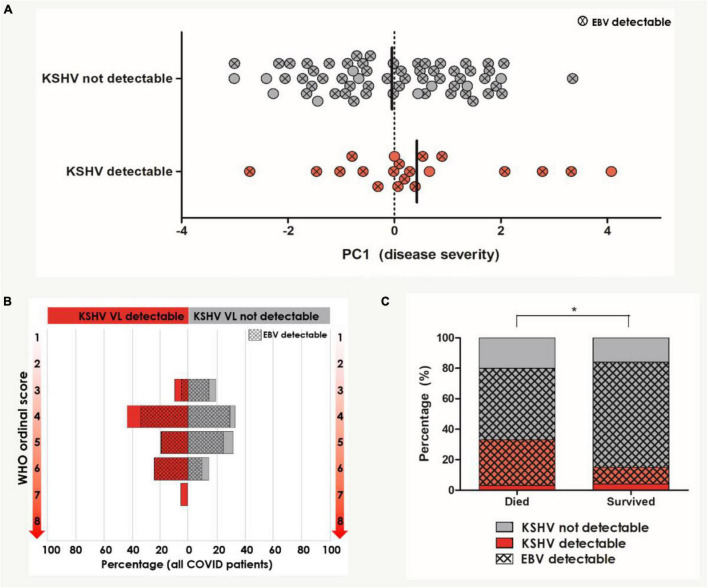
FIGURE 2.
Univariate analysis of KSHV and EBV VL detection in relation to COVID-19 severity and outcome (n = 104). (A) PC1 severity score amongst patients with and without detectable KSHV VL in the blood. Circles indicated with an X represent patients who also have detectable EBV VL in the blood. Bars indicate median. (B) The distribution of WHO ordinal scale scores between patients with and without detectable KSHV VL. Hash pattern indicates percentages of patients with detectable EBV VL. (C) The distribution of patients with and without detectable KSHV VL between patients who died and survived. Hash pattern indicates patients with detectable EBV VL. *Indicates the statistically significant proportion of patients with detectable KSHV and EBV VL who died compared to those who survived (p = 0.039). Participants with missing data were excluded pairwise.

