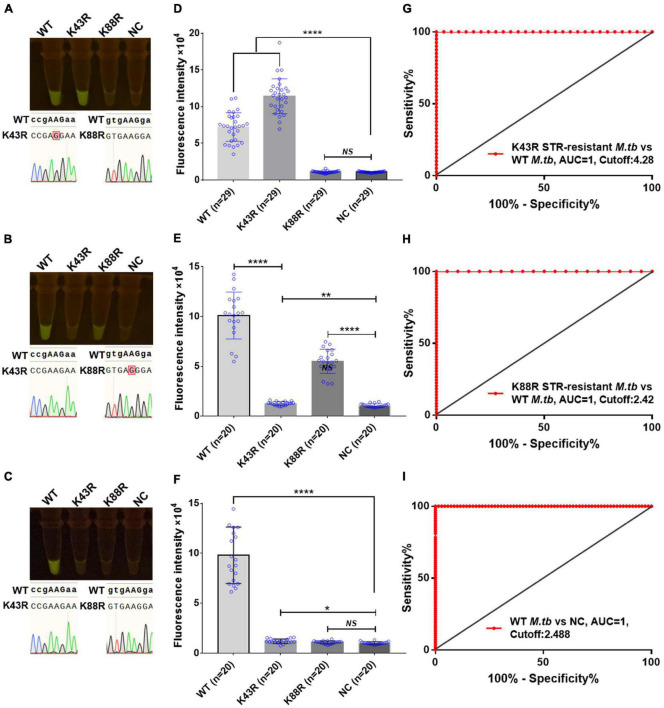
FIGURE 6.
Cas12a RR detects the clinical culture strains of streptomycin (STR)-resistant M. tuberculosis. The fluorescent images (A–C) and fluorescence intensity (D–F) at 15 min of reaction are shown. Diagnostic performance of Cas12a RR fluorescence system (G–I). (G) Receiver operating characteristic (ROC) curve of the fluorescence value of K43R STR-resistant M.tb vs. WT M.tb control group. (H) ROC curve of the fluorescence value of K88R STR-resistant M.tb vs. WT M.tb control group. (I) ROC curve of the fluorescence value of WT M.tb vs. NC control group. Cutoff values were determined using Youden’s index, i.e., the maximum of (sensitivity + specificity – 1). The content of the whole-genome template of the clinical sample used in the above-mentioned detection reaction is 1 ng. Data are presented as the mean ± SEM from at least three independent experiments. *p < 0.05, **p < 0.01, ***p < 0.001, and ****p < 0.0001.

