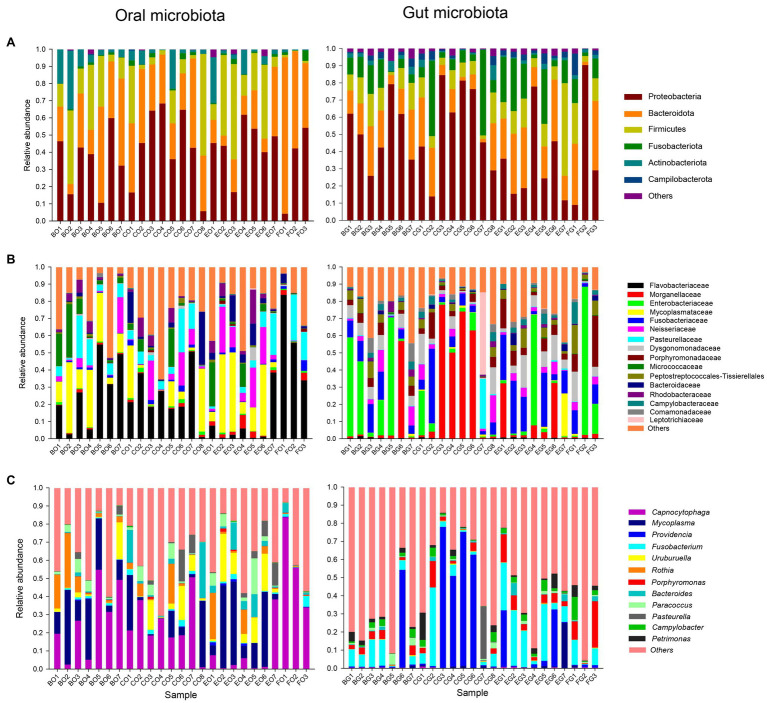
Figure 1.
The relative abundance of the oral and gut microbiota in each group at the phylum (A), family (B), and genus (C) levels. Each color in a plot represents a taxonomic group, of which the name is shown on the right side of the plot. The color for “others” indicates all other phyla (A), families (B), or genera (C) combined, of which the names are not listed in each plot. The first letter in each group indicates the item of food, such as B for bullfrogs, C for depilated chicken, E for eggs, and F for wild prey. The second letter in each group indicates a type of microbiota, G for the gut microbiota, and O for the oral microbiota.

