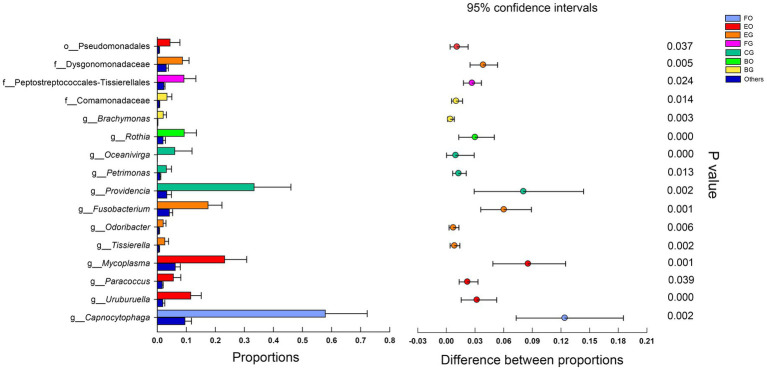
Figure 5.
Microbial relative abundance differences in different groups. The error bars are standard deviations error. The star indicates (p < 0.05) using Mann-Whitney U test. See Figure 1 for the definition of every group. The letters “o,” “f,” and “g” indicate order, family, and genus, respectively.

