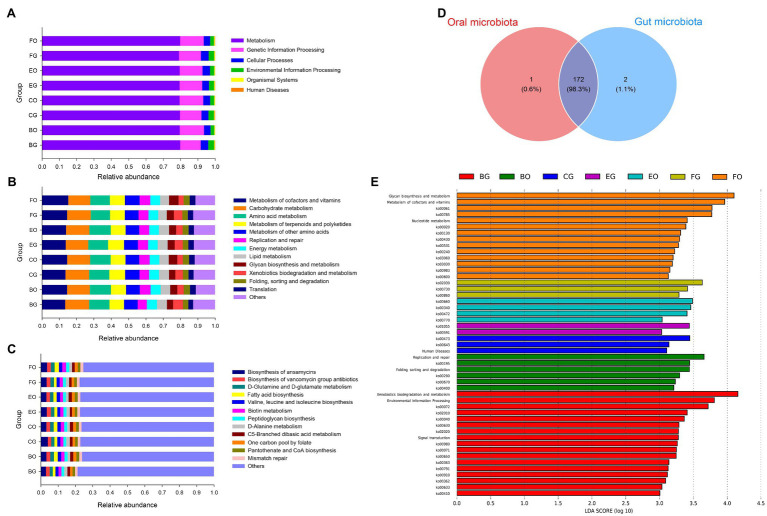
Figure 6.
Gene functional categories based on 16S RNA in the gut microbiota at top (A), second (B), and third (C) levels of relative abundance, and the Venn diagram of functional gene between the oral and cloacal samples (D). LDA scores reflect the differences in relative abundance among eight groups of microbiota samples (E). Each color in a plot indicates one gene function. Detailed descriptions are shown on the right side of each plot. The colors for others in Plots B and C indicate all other gene functions not listed in these two plots. See Figure 1 for the definition of every group.

