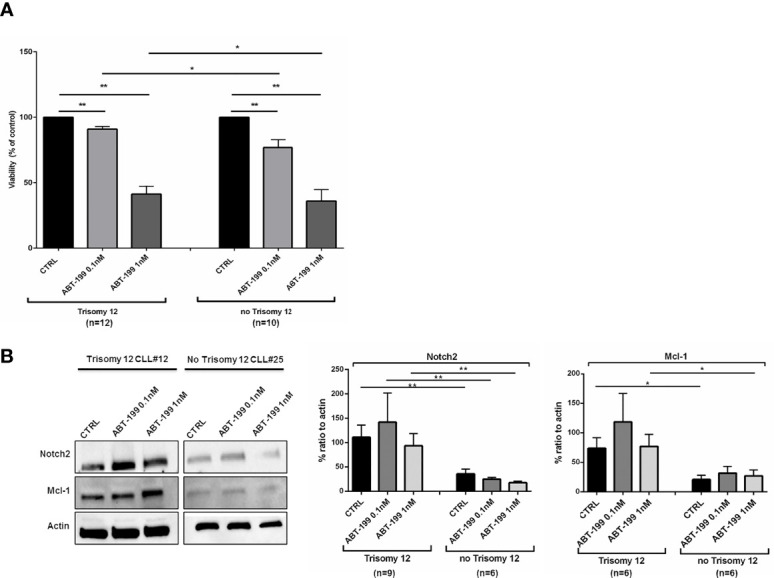
Figure 4.

Trisomy 12 chronic lymphocytic leukemia (CLL) cells show a reduced response to venetoclax through Notch2/Mcl-1 axis. (A) Bar diagrams show comparison on viability rate of trisomy 12 vs. no trisomy 12 CLL cells in the presence of venetoclax at two different doses of 0.1 and 1 nM treatment for 24 h (*p < 0.05, **p < 0.01). (B) Immunoblots represent the level of Notch2 and Mcl-1 in one representative trisomy 12 CLL vs. no trisomy 12 CLL patient. On the right, bar diagrams show the densitometric quantification of Notch2 and Mcl-1 in +12 and no +12 CLL cells treated with venetoclax for 24 h (*p < 0.05).
