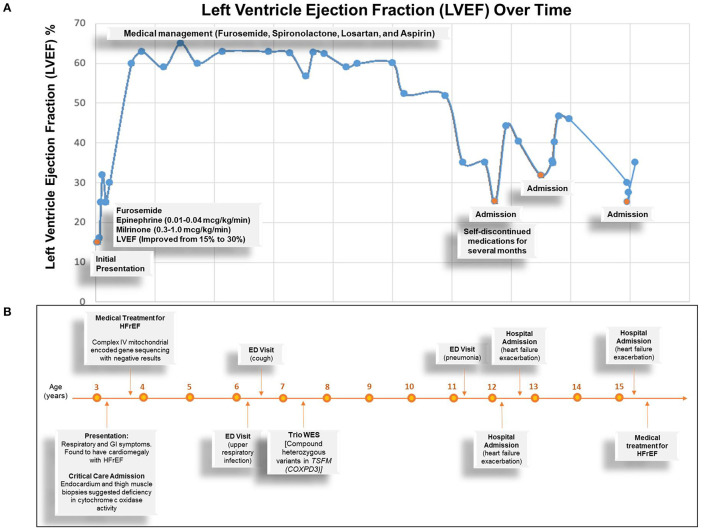
Figure 4.
Summary of Clinical Time Course of the Proband. (A) Graph depicts left ventricle ejection fraction percentage overtime. Blue dots represent the time of measurements. Orange dots represent the times of admission and related events (texts). (B) Summary of clinical time course depicts important clinical events over time. HFrEF, heart failure with reduced ejection fraction; ED, emergency department; COXPD3, combined oxidative phosphorylation deficiency 3.

