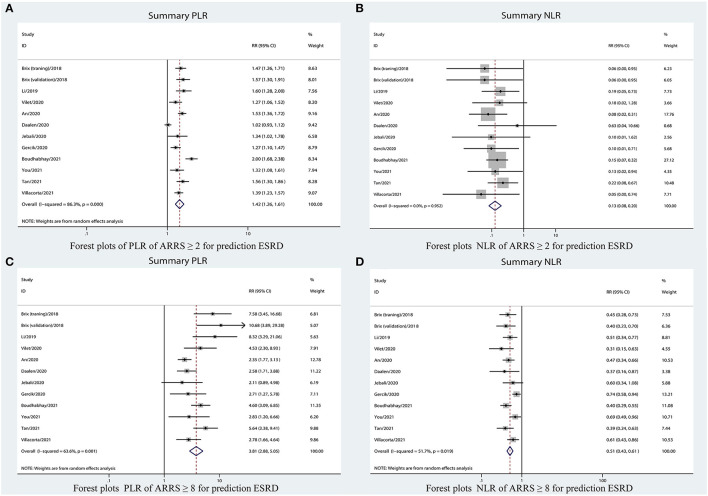
Figure 6.
Forest plots of LR of ARRS for prediction ESRD. (A) PLR for ARRS ≥ 2; (B) NLR for ARRS ≥ 2; (C) PLR for ARRS ≥ 8; and (D) NLR for ARRS ≥ 8. ESRD, end-stage renal disease; ARRS, antineutrophil cytoplasmic antibody renal risk score; PLR, positive likelihood ratio; NLR, negative likelihood ratio.

