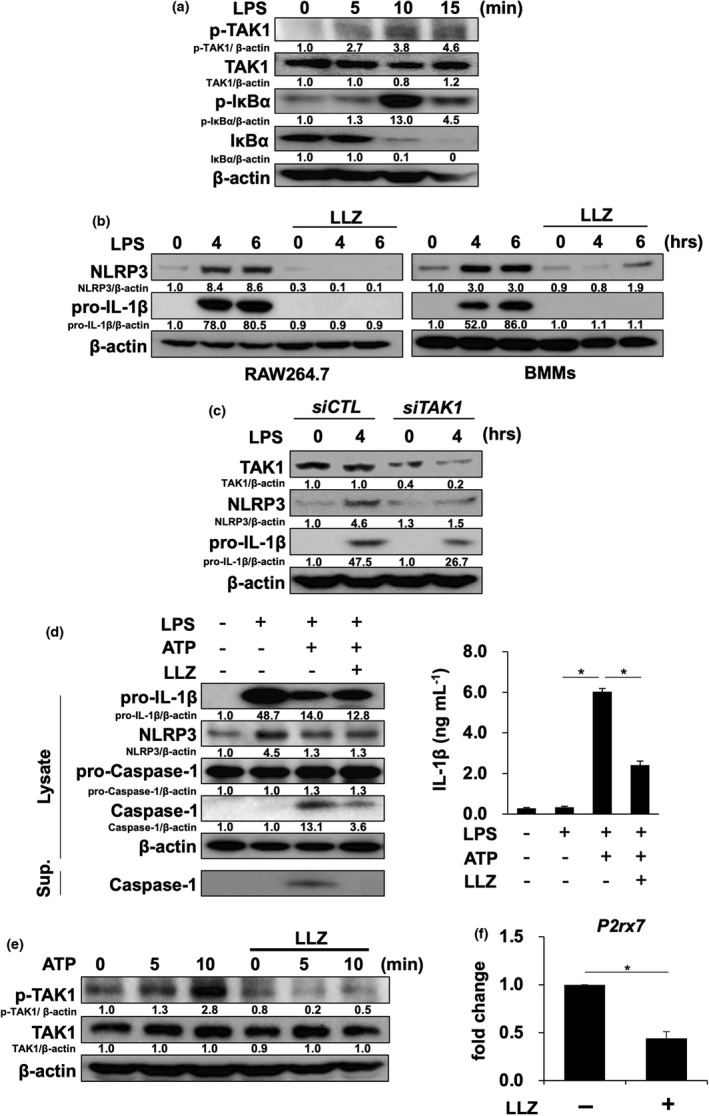
Figure 2.

LLZ suppresses the priming and activation of NLRP3 inflammasome. (a) The murine macrophage cell line RAW264.7 was starved with 1% FBS for 12 h and then incubated with or without the TAK1 inhibitor LLZ at 500 nm, followed by the addition of LPS (100 ng mL−1) for the indicated time periods. Protein levels of phosphorylated TAK1 (p‐TAK1), TAK1 and phosphorylated IκBα (p‐IκBα) and IκBα were detected by Western blotting. β‐Actin was used as a protein loading control. Relative changes in the band intensities standardised by respective loading controls are indicated. Representative data of 2 independent experiments are shown. (b) RAW264.7 cells and mouse bone marrow macrophages (BMMs) were incubated with LPS (100 ng mL−1) in the presence or absence of LLZ (500 nm). Protein levels of NLRP3, pro‐IL‐1β and β‐actin were detected by Western blotting. Representative data of 2 independent experiments are shown. (c) TAK1 siRNA or control siRNA was transfected into RAW264.7 cells. After the transfection, the cells were treated with LPS (100 ng mL−1) for 4 h. Protein levels of NLRP3, pro‐IL‐1β, TAK1 and β‐actin were detected by Western blotting. Representative data of 2 independent experiments are shown. (d) BMMs were primed with LPS (100 ng mL−1) for 6 h, and then, ATP (2 mm) was added onto the BMMs with or without LLZ (500 nm). After incubating for 30 minutes, the cells were lysed and their supernatants (Sup.) were collected. Western blotting was performed to detect the protein levels of NLRP3, pro‐IL‐1β, pro‐caspase‐1, caspase‐1 and β‐actin in the cell lysates and caspase‐1 in their supernatants (left). IL‐1β production from BMMs was assessed by ELISA (right). Data are expressed as mean ± SD (n = 4). *P < 0.05 by one‐way ANOVA with Tukey’s test. Representative data of 4 independent experiments are shown. (e) RAW264.7 cells were starved with 1% FBS for 12 h and then incubated for 1 h with or without LLZ at 500 nm, followed by the addition of ATP at 2 mm for the indicated time periods. Protein levels of phosphorylated TAK1 (p‐TAK1) and TAK1 were analysed by Western blotting. β‐Actin was used as a protein loading control. Representative data of 2 independent experiments are shown. (f) RAW264.7 cells were treated with or without LLZ (500 nm) for 3 h. RNA was collected, and the expression of ATP receptor, P2rx7, was detected by real‐time PCR. Gapdh served as an endogenous control to normalise each sample. Real‐time PCR was performed with 3 independent samples. Data are expressed as mean ± SD. *P < 0.05 by the Student’s t‐test.
