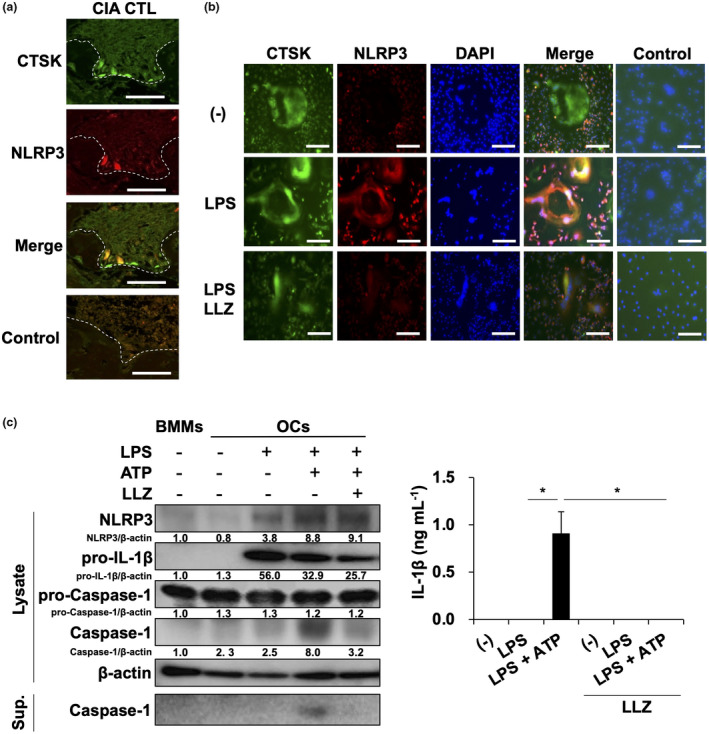
Figure 4.

LLZ suppresses NLRP3 formation in OCs. (a) Coexpression of cathepsin K (CTSK), an osteoclastic marker, and NLRP3 in tissue sections of hind paws in CIA mice. Scale bars represent 50 μm. Original magnification ×400. (b) Osteoclastogenesis was induced from BMMs upon treatment with M‐CSF and RANKL. After non‐adherent cells were washed out, adherent osteoclastic lineage cells were cultured with LPS (100 ng mL−1) in the presence or absence of LLZ (500 nm) for 24 h. After fixation, the cells were stained with antibodies against CTSK and NLRP3. Nuclei were detected with DAPI staining. Scale bars represent 100 μm. Original magnification ×100. (c) OCs were prepared from BMMs as described in the Methods. OCs were cultured with LPS (100 ng mL−1) for 6 h. After washing, the OCs were then incubated with ATP (2 mm) for 30 min. Cell lysates and culture supernatants were collected. Western blotting was performed to assess the protein levels of NLRP3, pro‐IL‐1β, pro‐caspase‐1, caspase‐1 and β‐actin in the cell lysates and caspase‐1 in the culture supernatants (left). Relative changes in the band intensities standardised by respective loading controls are indicated. IL‐1β production from BMMs was assessed by ELISA (right). Data are expressed as mean ± SD (n = 4). *P < 0.05 by one‐way ANOVA with Tukey’s test. Representative data of 3 independent experiments are shown.
