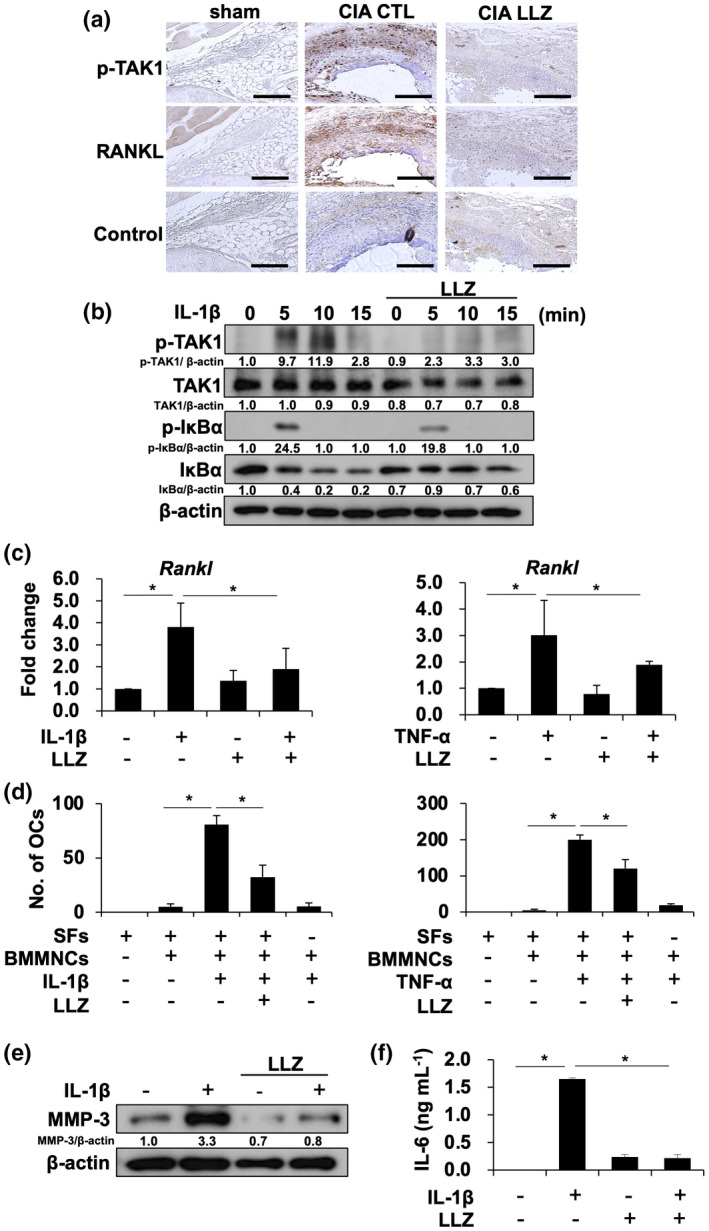
Figure 5.

LLZ attenuates RANKL expression in synovial fibroblasts, while directly inhibiting OC differentiation. (a) Phosphorylated TAK1 (p‐TAK1) and RANKL expression in synovial tissues in knee joints of sham and CIA mice. Scale bars represent 200 μm Original magnification ×100. (b) Synovial fibroblasts isolated from CIA mice were starved for 12 h with 1% FBS, and then incubated for 1 h with or without LLZ at 500 nm, followed by the addition of IL‐1β at 20 ng mL−1 for the indicated time periods. Protein levels of p‐TAK1, TAK1, p‐IκBα and IκBα were detected by Western blotting. β‐Actin was used as a protein loading control. Relative changes in the band intensities standardised by respective loading controls are indicated. (c) Synovial fibroblasts were cultured for 8 h with IL‐1β (10 ng mL−1) (left) or TNF‐α (10 ng mL−1) (right) in the presence or absence of LLZ at 250 nm. Rankl mRNA expression was determined using real‐time PCR. Gapdh served as an endogenous control to normalise each sample. Data are expressed as mean ± SD (n = 4). *P < 0.05 by one‐way ANOVA with Tukey’s test. Representative data of 3 independent experiments are shown. (d) Murine bone marrow mononuclear cells (BMMNC) (2 × 10⁵ cells/well) were seeded onto synovial fibroblasts (SFs) (5 × 10³ cells/well in 24‐well culture plates). The cells were treated with M‐CSF (10 ng mL−1) for 3 days to generate pre‐osteoclastic cells, followed by the addition of IL‐1β (20 ng mL−1) (left) or TNF‐α (25 ng mL−1) (right) with or without LLZ (250 nm). TRAP‐positive cells containing three or more nuclei were counted as mature OCs after culturing for 14 days. Data are expressed as mean ± SD (n = 4). *P < 0.05 by one‐way ANOVA with Tukey’s test. Representative data of 3 independent experiments are shown. (e) Synovial fibroblasts were cultured for 24 h with or without IL‐1β (20 ng mL−1) in the presence or absence of LLZ at 500 nm. Protein levels of MMP‐3 and β‐actin were analysed by Western blotting. Representative data of 3 independent experiments are shown. (f) Synovial fibroblasts were cultured for 24 h with or without IL‐1β (20 ng mL−1) in the presence or absence of LLZ at 500 nm. IL‐6 concentrations in culture supernatants were determined by ELISA. Data are expressed as mean ± SD (n = 3). *P < 0.05 by one‐way ANOVA with Tukey’s test. Representative data of 3 independent experiments are shown.
