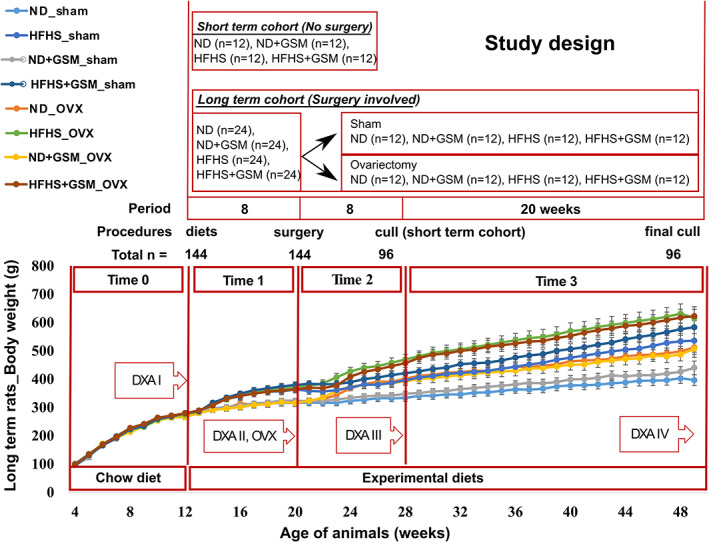
Fig 1.

Study plan and body weight (BW) gain in rats along the long‐term cohort. Individual rat body weights were recorded in grams every week. Group mean ± SE are shown, plotted in the line graph. ND = normal control diet; HFHS = high‐fat/high‐sugar diet; OVX = ovariectomy; DXA = dual energy X‐ray absorptiometry scanning. The periods of the study were specified as “Time”; Time 0 = rat growing period on standard chow; Time 1 = experimental diets provided for 8 weeks; Time 2 = 8 weeks after the surgical procedure; Time 3 = termination of the study.
