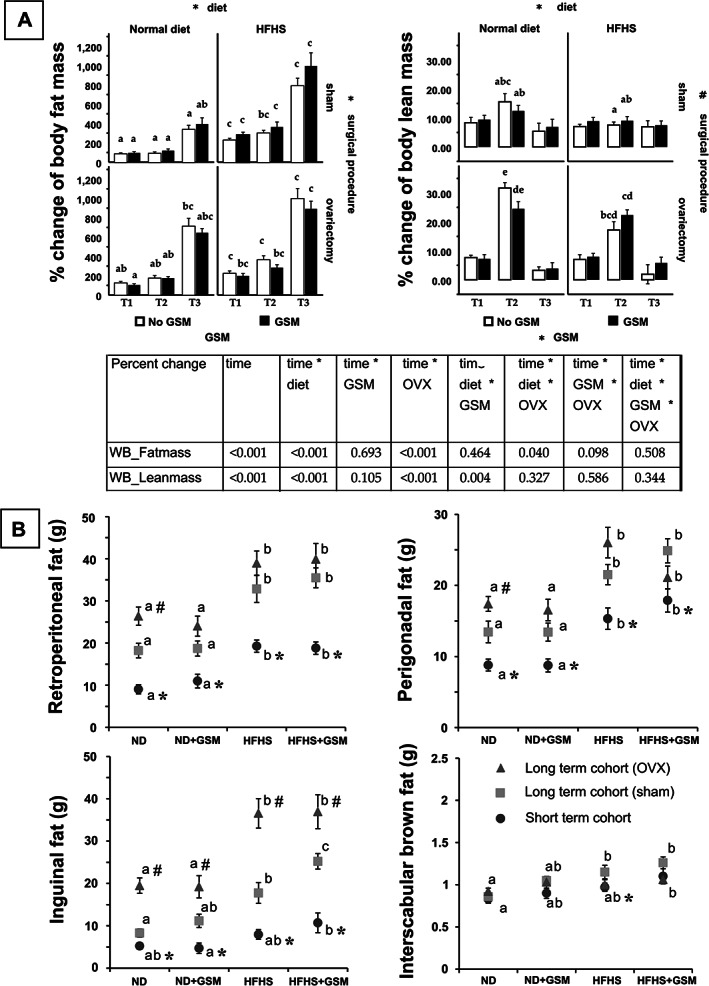
Fig 2.

Changes in body composition. Body composition was measured by dual‐energy X‐ray absorptiometry in the long‐term cohort rats (12 to 48 weeks old) (A). Then data were statistically analyzed by repeated measured method and a summary of p value was reported in the table. The signs (* or #) adjacent to the name of the effects (diet, surgical procedure, Greenshell mussel [GSM]) indicate significant differences. In case of an interaction effect, the same sign is present on those effects. One‐way ANOVA and a multiple comparison (least significant difference test) were also used to analyze the data across all groups. The differences of letters indicate significant differences. At the end of each study, all rats were euthanized and each type of fat pad was harvested and weighed (B). Data are summarized in box‐whisker graphs that represent mean ± SE. One‐way ANOVA and the least significant difference test were used to analyze data across the groups, then different superscript letters were given to indicate statistical significance. Independent t test was used to compare the data in the same diet condition. An asterisk (*) shows significant difference when comparing the short‐term cohort with the long‐term (sham). Hashtag (#) was used instead for comparison between the sham rats and OVX rats. All statistical significance was determined by p value < 0.05. ND = normal control diet; HFHS = high‐fat/high‐sugar diet; OVX = ovariectomy. Short‐term cohort = non‐operated rats euthanized at 26 weeks of age; long‐term cohort (sham) = intact rats euthanized at 48 weeks of age; long‐term cohort (OVX) = ovariectomized rats euthanized at 48 weeks of age.
