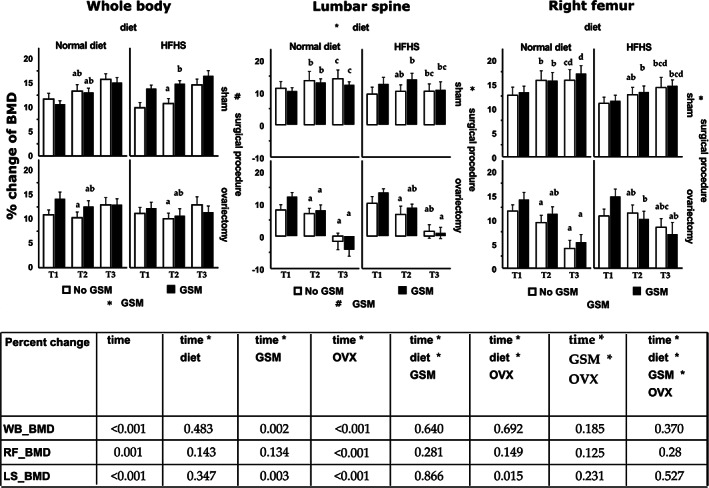
Fig 4.

Percent change of bone mineral density in long‐term cohort rats (12 to 48 weeks old). The individual chart represents bone mineral density (BMD) of the different bone sites, which are whole body (WB), lumbar spine (L1 to L4), and right femur. Bars and error bars represent means and SE (n = 12) of percent change between the baseline of bone mineral density (BMD) at week 12 and the particular time point (T1 or T2 or T3, which is week 20, 28, and 48, respectively). Repeated measure analysis was used to analyze statistically significant differences between the time points and those three effects (diet, GSM, and OVX). A sign (* or #) was labeled close to the name of the effects when statistical significance of the main effect was detected. The similar sign shown on different effects means the significance of the interaction effect between those. One‐way ANOVA and least significant difference methods were used to analyze data between groups within one particular time point, then differences of superscript letters show statistical significance. A table summary from repeated measures analysis shows p values, which is significant <0.05. ND = normal control diet; HFHS = high‐fat/high‐sugar diet; OVX = ovariectomy; GSM = Greenshell mussel.
