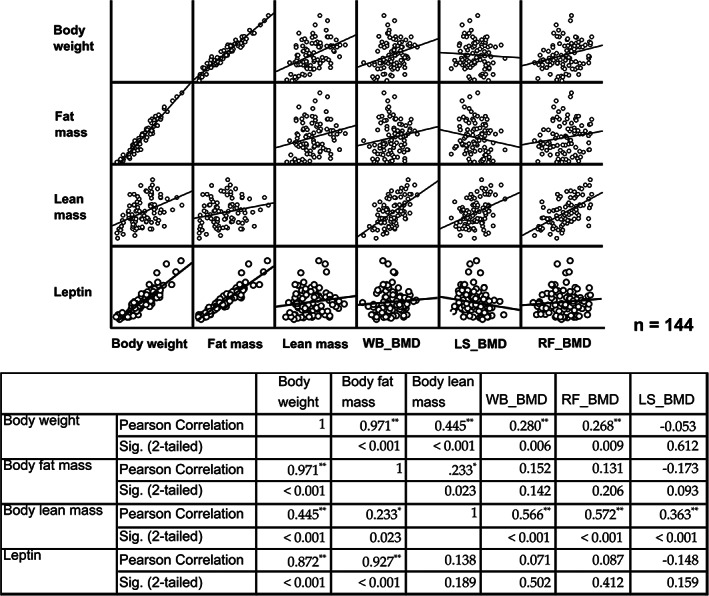
Fig 5.

Correlation of body weight or fat mass or lean mass or leptin against bone mineral density of different bone sites. The data at the final time point (T3) from all rats of the long‐term cohort was pooled together and analyzed. Correlation is presented in both figures and values from Pearson correlation method. Statistical significance was set at p < 0.05 and asterisk (*) was indicated. **p < 0.01; ***0.001. WB = whole body; LS = lumbar spine; RF = right femur.
