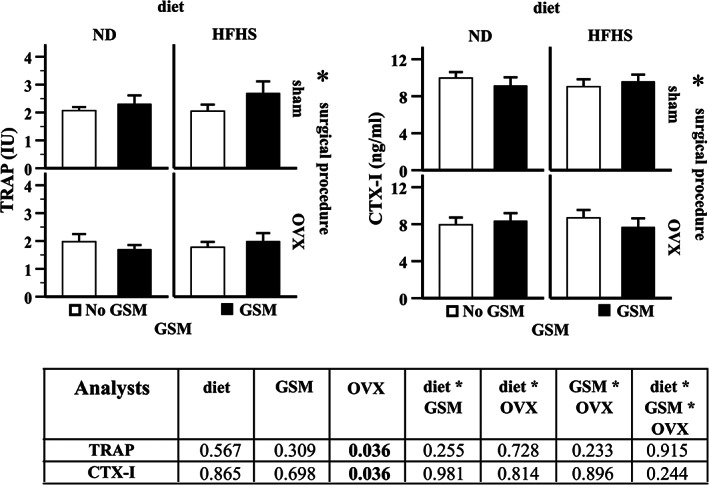
Fig 7.

Changes in plasma bone markers. Plasma analysis was measured in the rats at 48 weeks of age. Bar graphs with error bars show means ± SE. Two‐way ANOVA was used to evaluate the influence of effects of diet, surgical procedure, and GSM. If the effect was statistically significant, and asterisk (*) is indicated. A table summary from two‐way ANOVA analysis shows p values that are significant at <0.05. ND = normal control diet; HFHS = high‐fat/high‐sugar diet; OVX = ovariectomy; GSM = Greenshell mussel.
