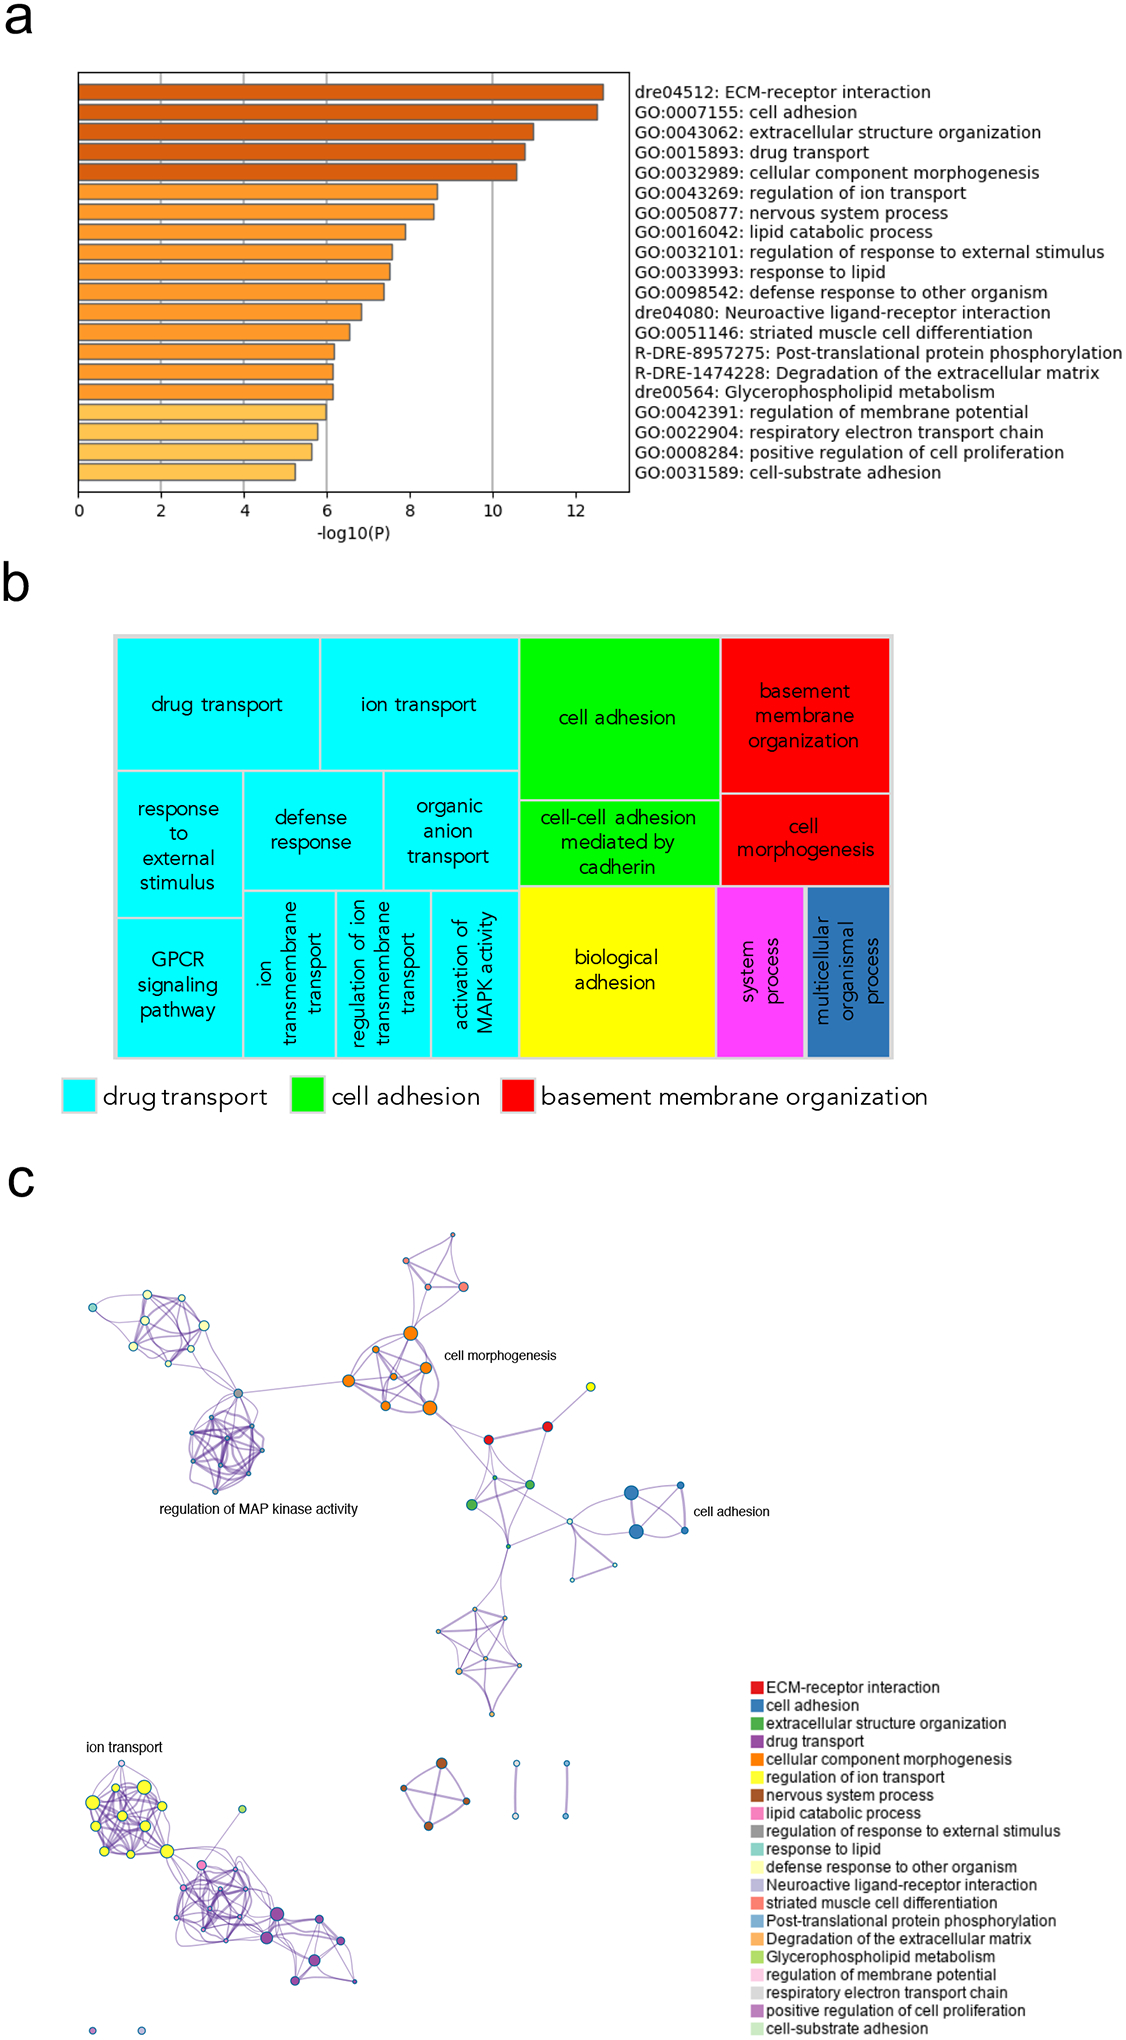
Figure 7.

Pathway and network analysis at the onset of gastrulation (50% epiboly) in MZgpr101 mutants. a) Pathway enrichment analysis was performed with Metascape by selecting the custom analysis option and uploading a background list of genes appropriate for the developmental stage under study. The list was extracted from White et al. (White et al., 2017). Out of the 1008 DE genes (±2 log2 fold change threshold), 785 genes were recognized by the software when applying these parameters. The top non-redundant enrichment clusters are shown. b) Gene ontology (GO) treemap based on the enrichment of the most differentially expressed transcripts. GOrilla was used to determine enrichment of transcripts based on the minimum hypergeometric scoring method. Redundant GO terms were filtered with the GO Trimming tool and then visualized with REViGO. Each box is a single cluster representative. Box sizes correlate to the −log10 p value of the GO-term enrichment. Boxes with the same color are grouped by semantic similarity (SimRel, similarity = 0.7) into superclusters of loosely related terms. Drug transport and cell adhesion were confirmed among the most enriched superclusters. c) Network analysis was performed with Metascape using the settings outlined above for pathway analysis.
