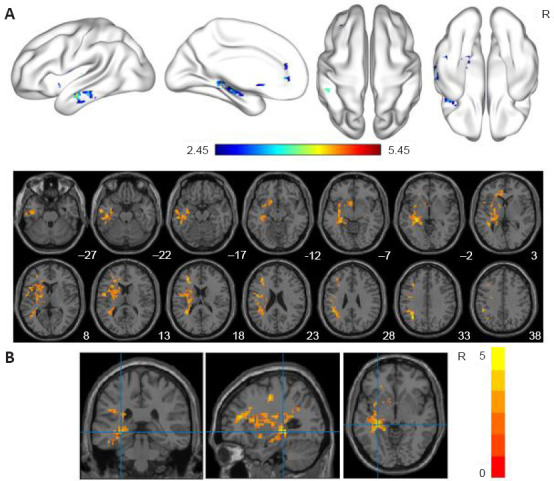
Figure 2.

ALFF analyses in the individuals who had recovered from COVID-19.
(A) Significantly increased ALFF in the RecCOVID group. The 5000 permutations test was performed with threshold-free cluster enhancement (single voxel-level threshold of P < 0.05, cluster size > 10 voxels). (B) Peak in the cluster (cluster size: 78 mm3, peak MNI coordinates: −30, −33, −3, peak t value: 5.4507). The dark red (A) and yellow (B) on the color bar indicate brain regions in which the ALFF values differed significantly between the RecCOVID and HC groups. ALFF: Amplitude of low-frequency fluctuation; COVID-19: coronavirus disease 2019; HC: healthy control; MNI: Montreal Neurological Institute; R: right.
