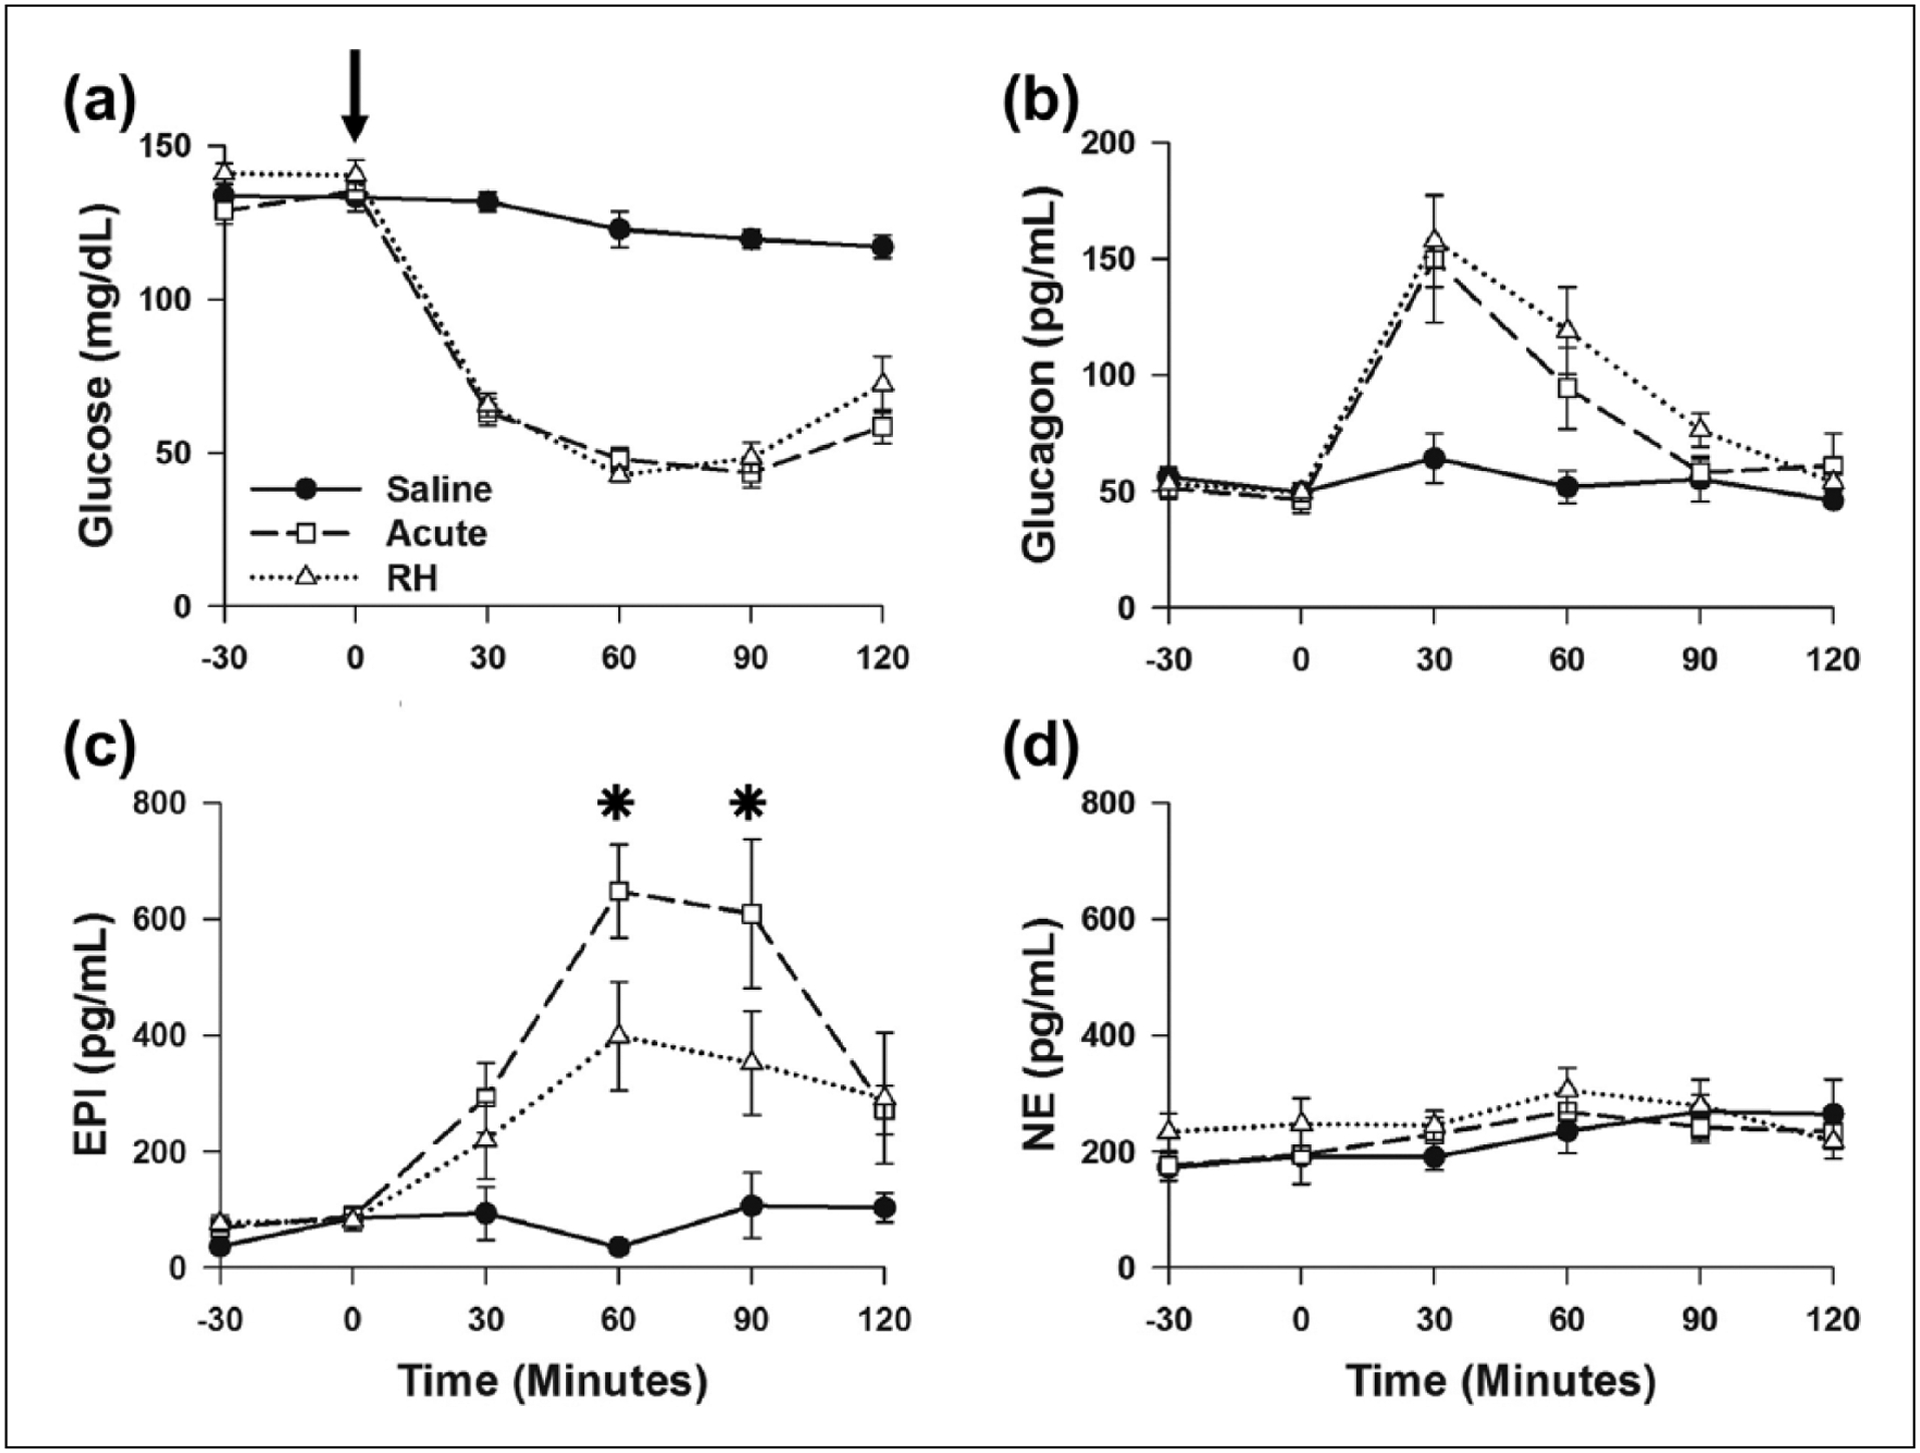
Figure 1.

RH specifically decreased EPI response to a subsequent bout of IIH: (a) blood glucose, (b) plasma glucagon, (c) EPI and (d) NE concentrations. Saline (n = 6), Acute (n = 9) and RH (n = 9).
RH: recurrent hypoglycaemia; EPI: epinephrine; IIH: insulin-induced hypoglycaemia; NE: norepinephrine.
*P < 0.05, Acute versus RH. Arrow indicates time of saline (Saline) and insulin (Acute and RH) treatments.
