Figure 2.

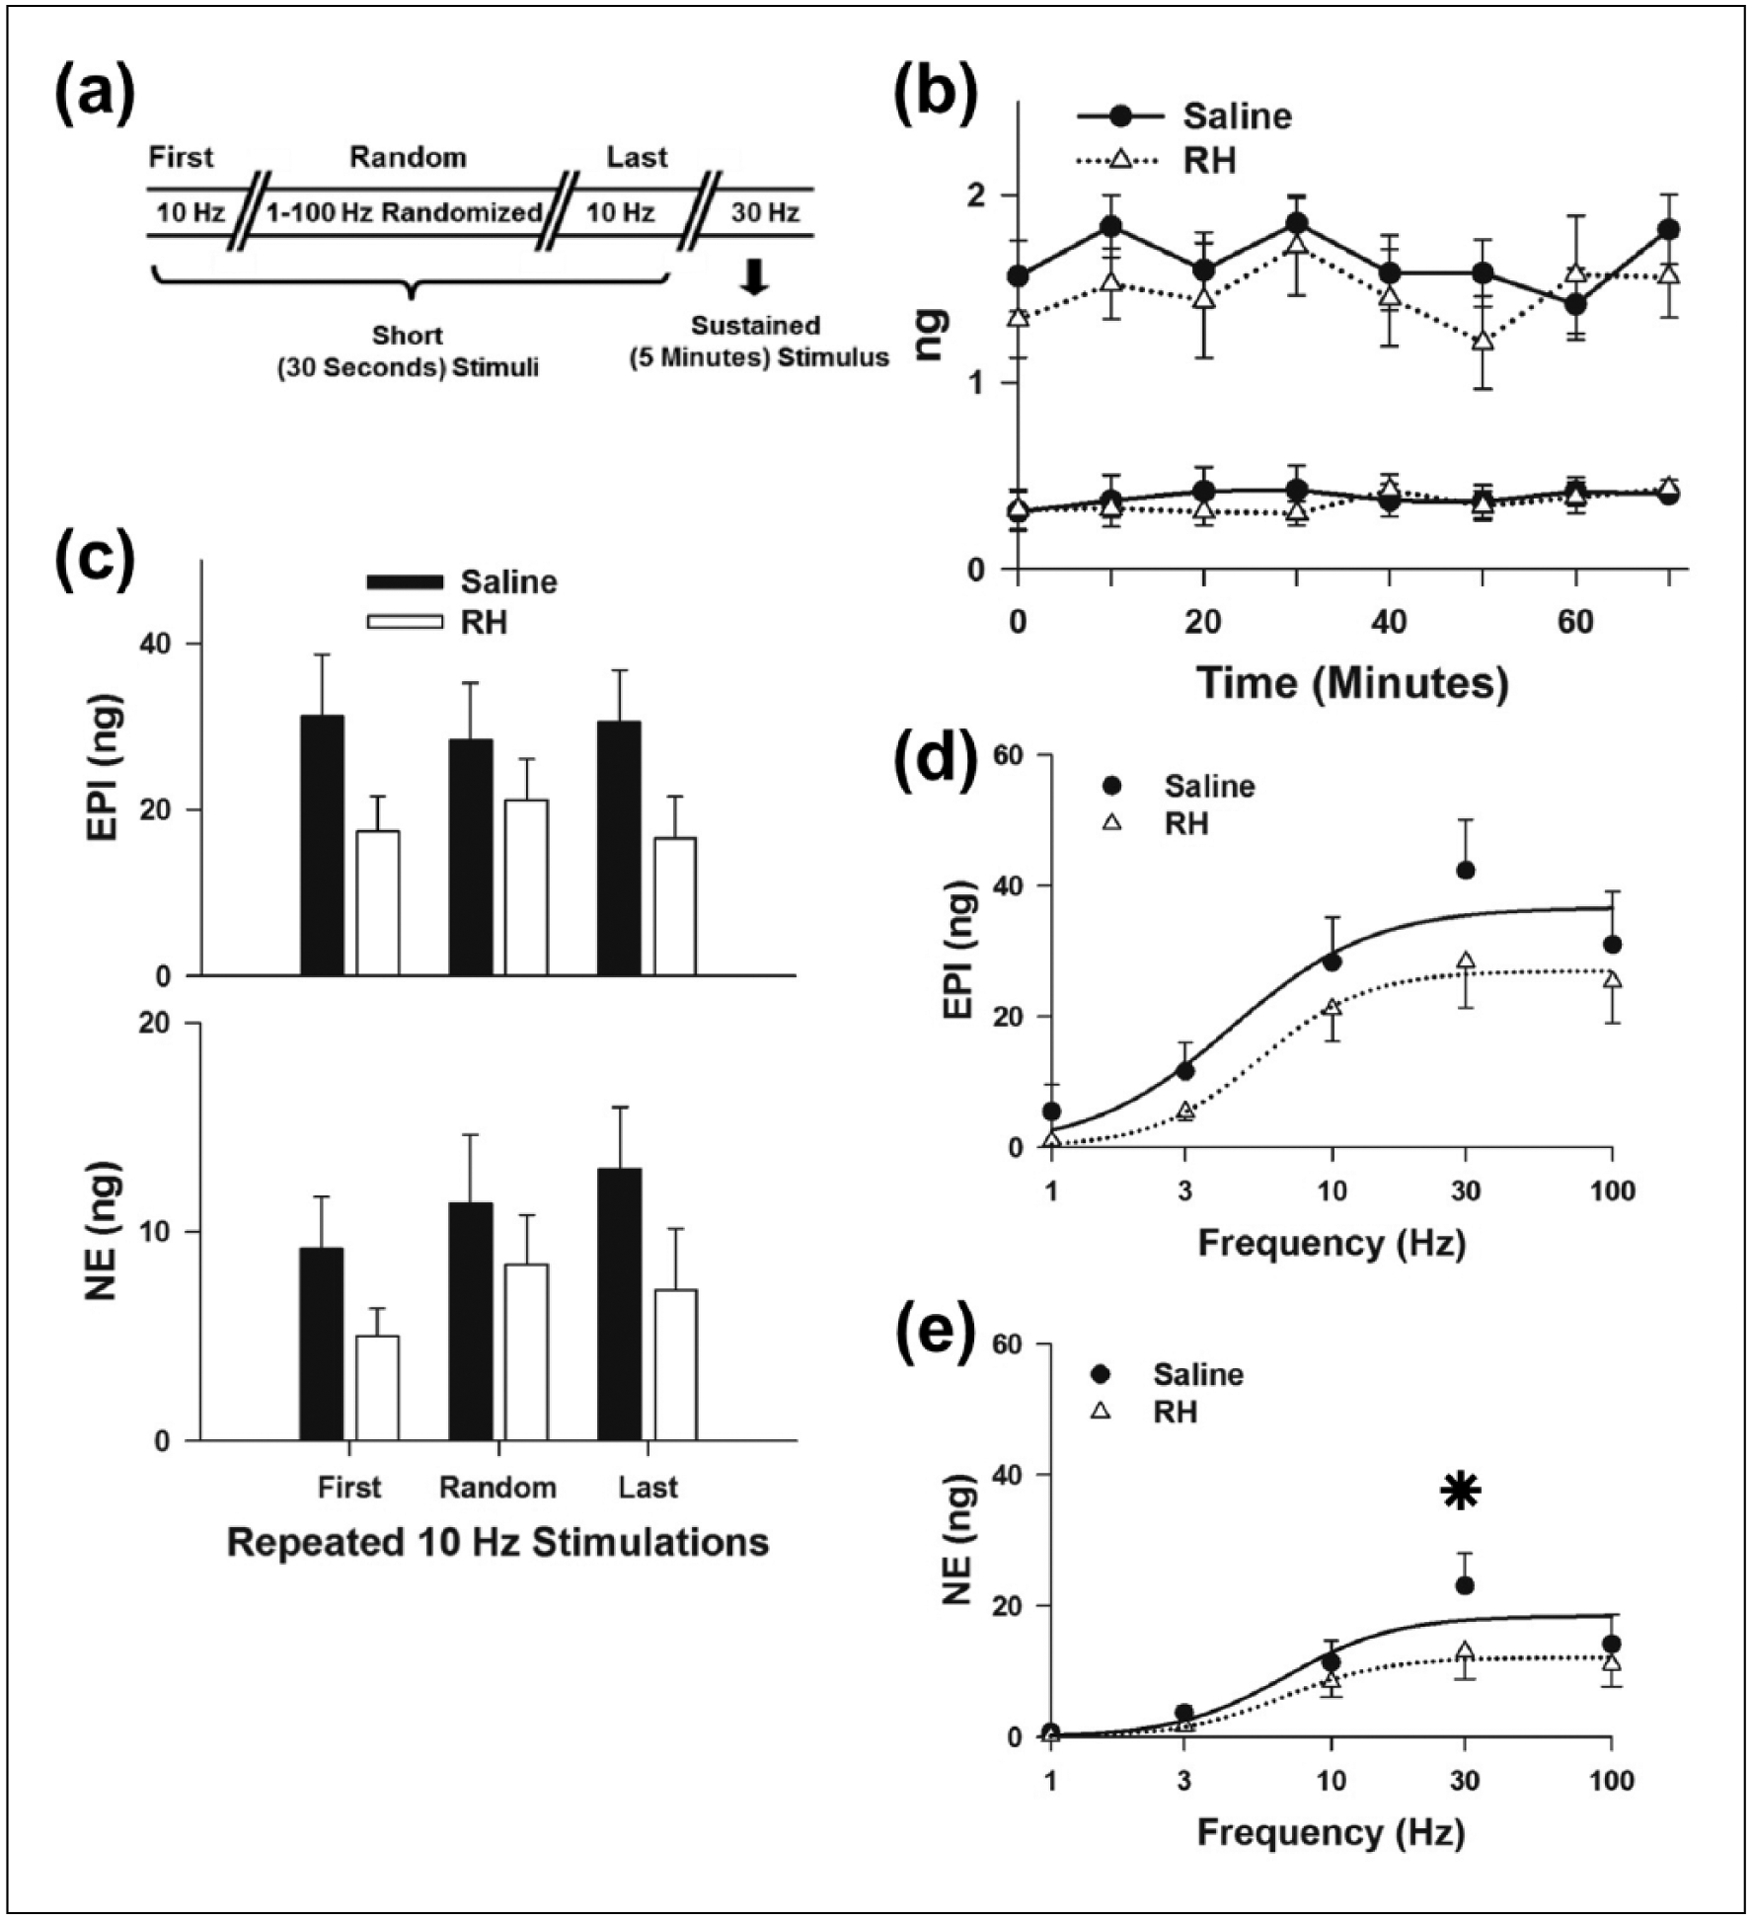
Characterization of CAT release evoked by in vivo electrical stimulation of the splanchnic nerves innervating the LAG: (a) sequence of electrical stimulations applied during the experimental period, (b) basal release of CAT before each electrical stimulation, (c) CAT release evoked by repeated short stimulations at 10 Hz, (d) EPI and (e) NE release evoked by randomized short stimulations (1–100 Hz). Sigmoidal curves were fitted to Saline (—) and RH data (····), respectively. Saline (n = 6) and RH (n = 8).
CAT: catecholamine; RH: recurrent hypoglycaemia; EPI: epinephrine; NE: norepinephrine; LAG: left adrenal gland.
*P < 0.05, Saline versus RH.
