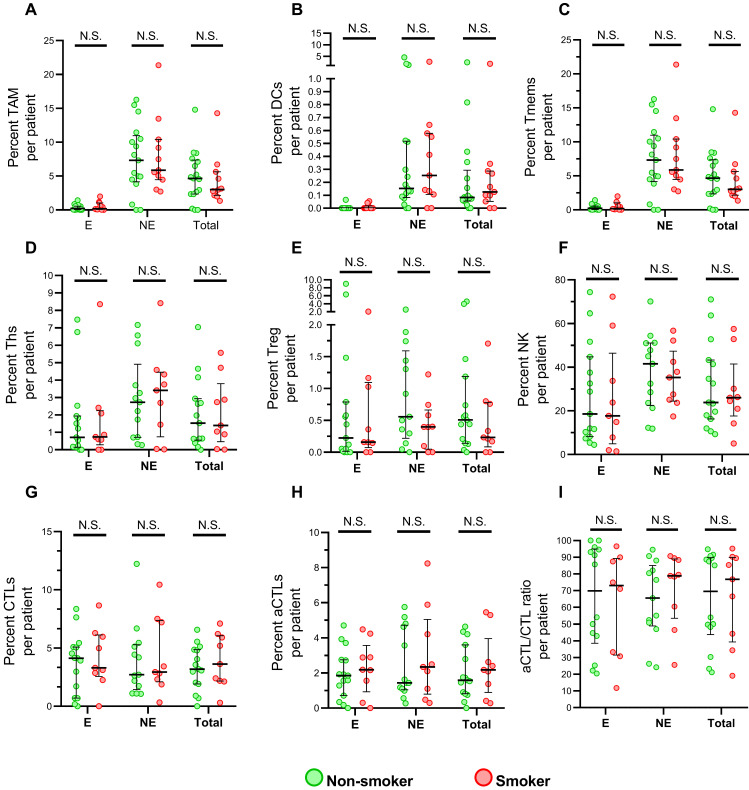
Figure 1.
Immune populations infiltrating in normal esophageal epithelial cells between smoker and non-smokers. (A-I) Grouped comparisons of immune subpopulations in epithelial and nonepithelial regions per patient for TAM (A), DCs (B), Tmems (C), Ths (D), Treg (E), NK (F), CTLs (G), aCTLs (H) and aCTL/CTL ratio (I) between smokers(n=12) and non-smokers(n=17). The data was presented with median and interquartile range. E, epithelial region. NE, nonepithelial regions. N.S. no significance.

