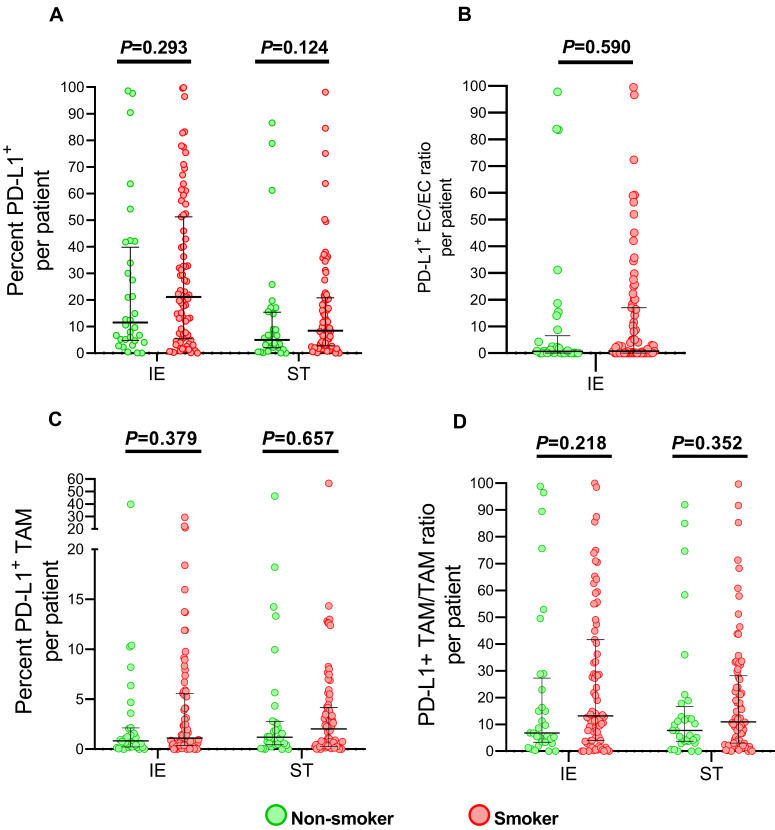
Figure 4.
PD-L1 expression infiltrating immune cells in tumor specimens between smoking and non-smoking ESCC patients. Grouped comparisons of all cells expressing PD-L1 (A), PD-L1+ EC/EC ratio (B), TAM expressing PD-L1 (C) and PD-L1+ TAM/TAM ratio (D) in intraepithelial and stromal regions per patient between smokers(n=77) and non-smokers(n=32). The data was presented with median and interquartile range. IE, intraepithelial region. ST, stromal region.

