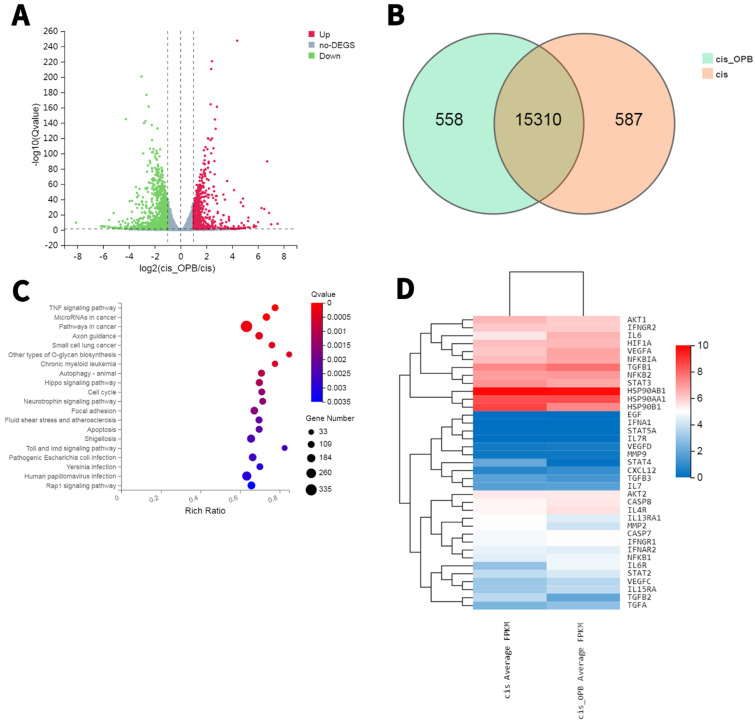
Figure 5.
RNA sequencing results reveal differentially expressed genes (DEGs) and enriched KEGG pathways in A549/DDP cells treated with or without OP-B. A. Volcano plot (bottom) showing 690 decreased genes and 1149 upregulated genes. B. Venn diagram showing DEGs between A549/DDP cells treated with or without OP-B. C. Top enriched KEGG pathways for these 652 DEGs, including pyroptosis signaling. D. Transcriptiomic RNA-seq identified 1839 DEGs. Hierarchical cluster analysis (top) of significantly differentially expressed mRNAs between A549/DDP cells treated with or without OP-B.

