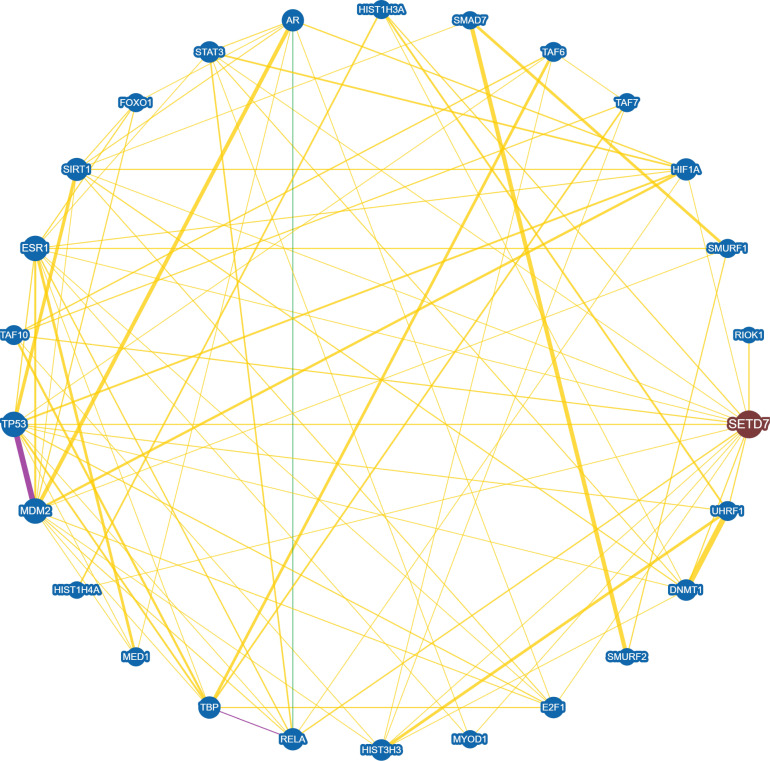
Figure 3.
Interaction network between SET7/9 and SET7/9 substrates with experimental evidences. Protein interaction and genetic correlations are analyzed using the online tool BioGRID version 4.4 (https://thebiogrid.org/). Yellow line indicates direct physical interaction between two proteins. Green line indicates genetic interaction between two proteins. Purple line indicates both physical and genetic interaction between two proteins.

