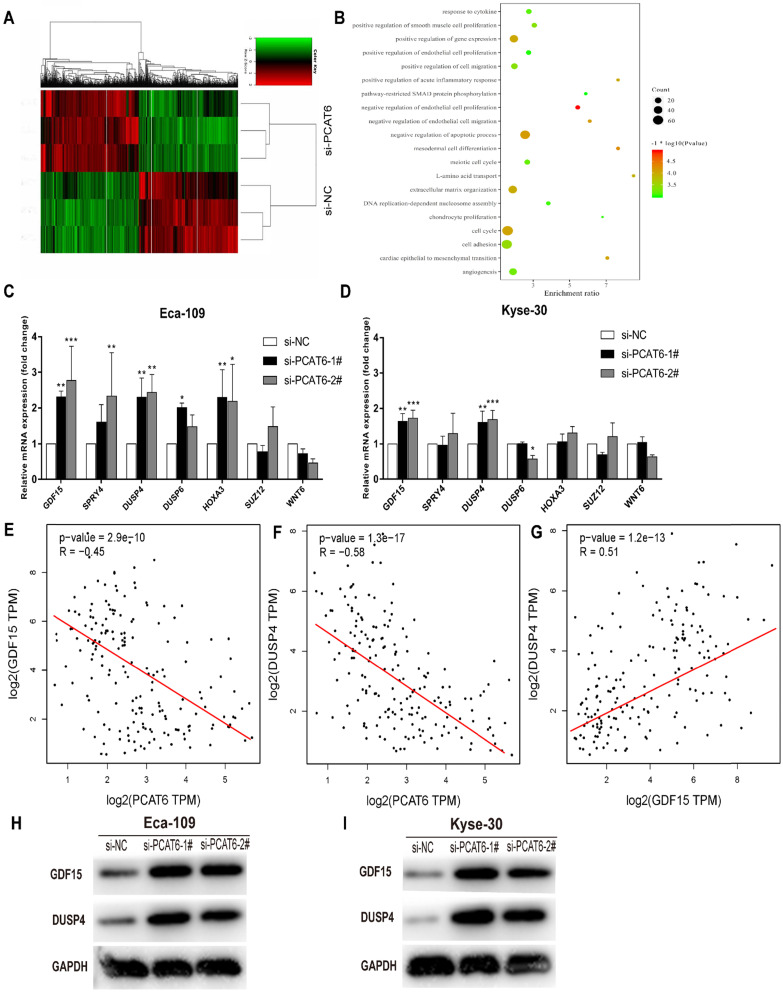
Figure 5.
The global gene expression profile regulated by PCAT6 and underlying target genes. (A) Mean-centered, hierarchical clustering of 1,278 gene transcripts altered (≥ 2-fold change) in the control and si-PCAT6-1#-treated Eca-109 cells, with three repeats. Red represents the high expression value, while green represents the low. (B) Gene ontology analysis for all genes with altered expressions. qRT-PCR was used to determine the changes of the altered genes expression which related to the cell proliferation after PCAT6 knockdown in (C) Eca-109 and (D) Kyse-30 cells. (E and F) The respective negative correlations were found between the expression levels of PCAT6 and GDF15, DUSP4 in TCGA ESCC samples. (G) Correlation between GDF15 and DUSP4 mRNA from TCGA database. Western blot assays were conducted to verify the change in the protein levels of related genes following knockdown of PCAT6 in (H) Eca-109 and (I) Kyse-30 cells. (*P < 0.05, **P < 0.01 and ***P < 0.001).

