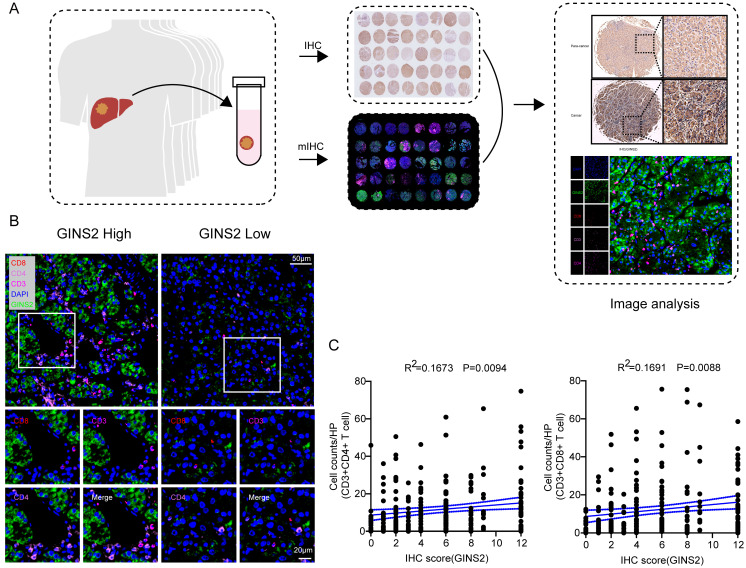
Figure 5.
Significant correlations between GINS2 levels and CD3+CD8+ T cells/ CD3+CD4+ T cells in the validation cohort. A. Schematic workflow of samples from validation cohort for traditional IHC and mIHC. B. Representative multiplex fluorescent immunohistochemistry images show the features of CD3+CD8+ T cells/CD3+CD4+ T cells within the tissues of high and low GINS2 expression. C. Correlation analyses of GINS2 protein levels (IHC Score) and infiltration of CD3+CD8+ T cells and CD3+CD4+ T cells in the validation cohort.

