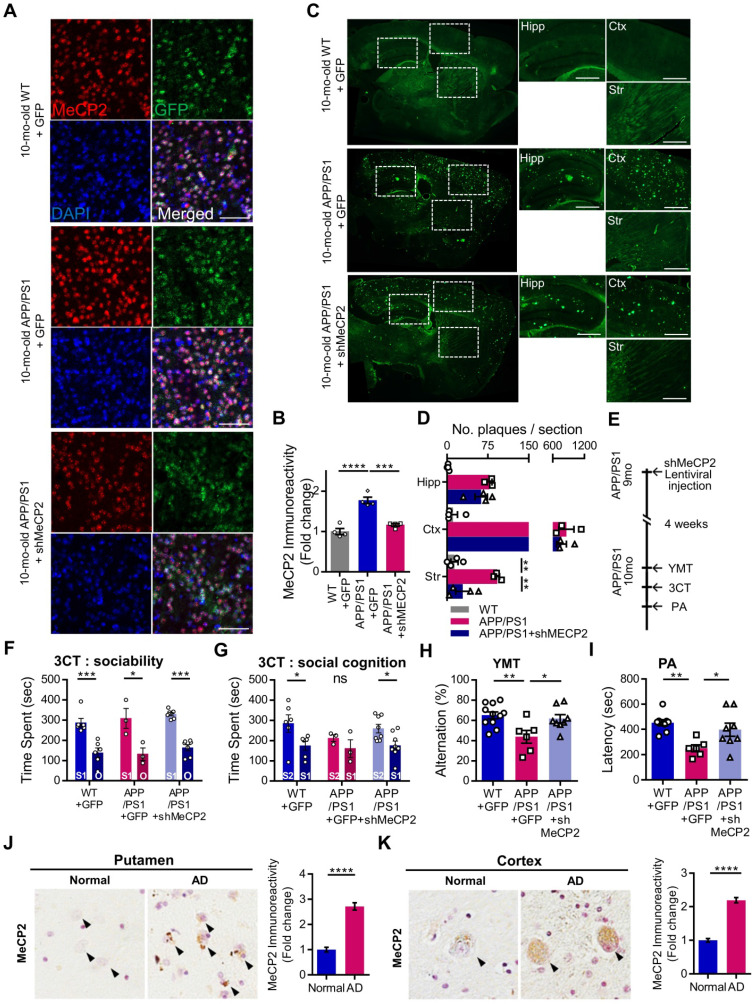
Figure 4.
10-month-old APP/PS1 with impaired memory also manifested defects in social cognition and knock-down of striatal MeCP2 rescued both cognitive deficits. (A) Representative IHC staining images of MeCP2, GFP, and DAPI from the striatal region of 10-mo WT with GFP virus injection (WT+GFP) and 10-mo APP/PS1 with GFP virus injection (APP/PS1+GFP) compared to APP/PS1 with shMeCP2 virus injection (APP/PS1+shMeCP2). Scale bars: 50 µm (B) Signal intensity of MeCP2 immunoreactivity was quantified in WT+GFP and APP/PS1+GFP compared to APP/PS1+shMeCP2 as fold change in MeCP2 immunoreactivity (mean ± SEM, n = 4 each; ***P < 0.001, ****P < 0.001; One-way ANOVA with Tukey post-hoc test). (C) Representative thioflavin S staining images of sagittal sections. Distinctive bright green locales on sections from APP/PS1 mice reveal Aβ plaques. Hipp: hippocampus, Ctx: cerebral cortex, Str: striatum, Scale bars: 300 µm (D) Number of plaques in each region (mean ± SEM, WT+GFP n = 4; APP/PS1+GFP n = 4; APP/PS1+shMeCP2 n = 4, **P < 0.01). (E) Experimental schedule of behavioral tests after stereotaxic injection of shMeCP2 virus. Tests were conducted 4 weeks after the surgery. (F) Time spent in chambers shown as a measure of sociability in the first session of the 3CT of WT+GFP, APP/PS1+GFP and APP/PS1+shMeCP2 groups. (G) Time spent in chambers as a measure of novelty-seeking in the second session of 3CT of WT+GFP, APP/PS1+GFP and APP/PS1+shMeCP2 groups (for (F) and (G), mean ± SEM, WT+GFP n = 6; APP/PS1+GFP n = 3; APP/PS1+shMeCP2 n = 8; Student's t-test, *P < 0.05, **P < 0.01, ***P < 0.001). (H) Memory function of WT+GFP, APP/PS1+GFP, and APP/PS1+shMeCP2 groups. Alternations in YMT arm exploration is indicated by percentage (mean ± SEM, WT+GFP n = 11; APP/PS1+GFP n = 6; APP/PS1+shMeCP2 n = 8; *P < 0.05, **P < 0.01). (I) In the PA test, time elapsed to escape the dark chamber is shown as latency in seconds (WT+GFP n = 9; APP/PS1+GFP n = 7; APP/PS1+shMeCP2 n = 8; *P < 0.05, **P < 0.01). (J) The immunoreactivity of MeCP2 in the putamen of AD postmortem brain compared to normal subject (Normal). Arrowheads (black) indicate MeCP2-positive neurons. Densitometry analysis showing the fold change of MeCP2 expression in the putamen of AD postmortem brains compared to brains from normal subjects (brown MeCP2-positive cells with purple hematoxylin counter staining, number of subjects (normal/AD) per group: N = 3, cell counts: n = 30 for each group (10 cells/1 subject); Student's t-test, ****P < 0.0001). (K) The immunoreactivity of MeCP2 in the temporal cortex of AD postmortem brains compared to brains from normal subjects (Normal). Arrowheads (black) indicate MeCP2-positive neurons. Densitometry analysis showing the fold change of MeCP2 expression in the temporal cortex of AD postmortem brains compared to brains from normal subjects. MeCP2 immunoreactivity was elevated within the nucleus and, partially, in the cytosolic compartment of neurons (brown MeCP2-positive cells with purple hematoxylin counter staining, number of subjects (normal/AD) per group: N = 3, cell counts: n = 30 for each group (10 cells/1 subject); Student's t-test, ****P < 0.0001).

