Figure 5.
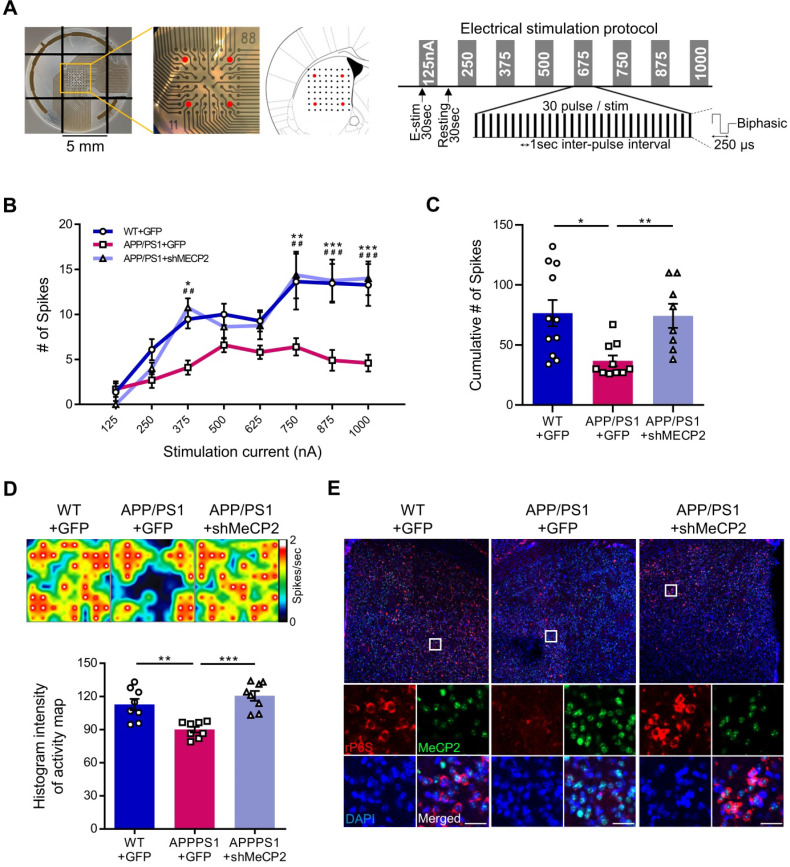
Knock-down of MeCP2 expression in the striatum rescued the neuronal activity of late-stage APP/PS1 mouse (10-month-old). (A) Diagram showing 4 stimulation positions (red dots) of the total 64 probes in each well and protocol summary of MEA experiment showing the stepwise increasing stimulation procedures (B) Line plot showing the number of stimulated firings of the striatal neurons after each stimulation current. High-current (750, 875, 1000 nA) stimulations showed significantly reduced firing in the APP/PS1+GFP group and rescued neuronal activity pattern in the knockdown group (mean ± SEM, n = 11, 10, 8 cells from 2 mice, respectively, *P < 0.05; **,##P < 0.01; ***,###P < 0.001; Asterisk indicates statistical significance between WT+GFP and APP/PS1+GFP; sharp indicates statistical significance between APP/PS1+GFP and APP/PS1+shMeCP2). (C) Bar graphs showing the cumulative number of firings from all stimulation currents (mean ± SEM, n = 11, 10, 8 cells from 2 mice, respectively, *P < 0.05, **P < 0.01). (D) Representative heatmap image and quantification (Histogram densitometry) bar graph of neuronal activity on the MEA probes. APP/PS1+MeCP2 knockdown group showed rescued patterns (n = 8, respectively, **P < 0.01, ***P < 0.001). (E) MeCP2 IHC staining (green) with rP6S (red) neuronal activity marker staining in the striatal region of WT, APP/PS1 and APP/PS1 with MeCP2 knockdown groups. Scale bars: 30 µm.

