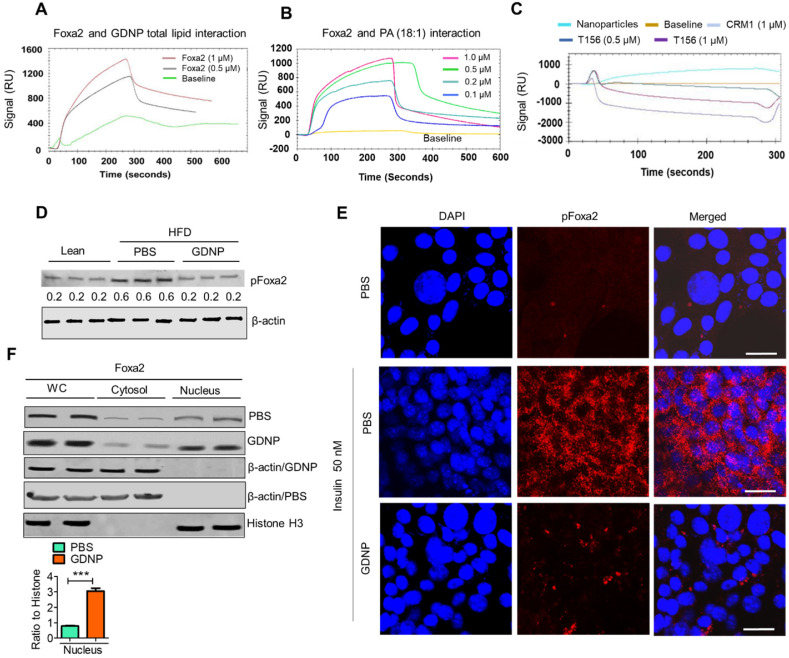
Figure 3.
Phosphatic acid protects Foxa2 from Akt-1 mediated phosphorylation by covering Thr156. A & B. The surface plasmon resonance (SPR) sensogram (response unit) representing the interaction between GDNP lipid nanoparticles (A) and phosphatidic acid (PA 18:1) nanoparticles (B) with recombinant Foxa2 protein. C. The SPR sensogram represents the interaction between PA (18:1) nanoparticles and the CRM1 and Thr156 Foxa2 synthesized peptide sequences. D. Western blot of phosphorylated Foxa2 (pFoxa2) expression in small intestinal tissue derived from lean and HFD mice (n = 3/group). The ratio to β-actin shown in the middle (numbers). E. Confocal images showing expression of pFoxa2 (red) in MC-38 cells cultured with 50 nM insulin and PBS or GDNP. Scale bar is 20 μM. F. Western blot of whole cell lysate (WC), nuclear and cytoplasmic levels of Foxa2 in MC-38 cells treated with PBS or GDNP. The ratio to histone for nuclear expression of Foxa2 shown on the right. Student t test (one tailed) were used to calculate statistical significance (p value ***<0.001).

