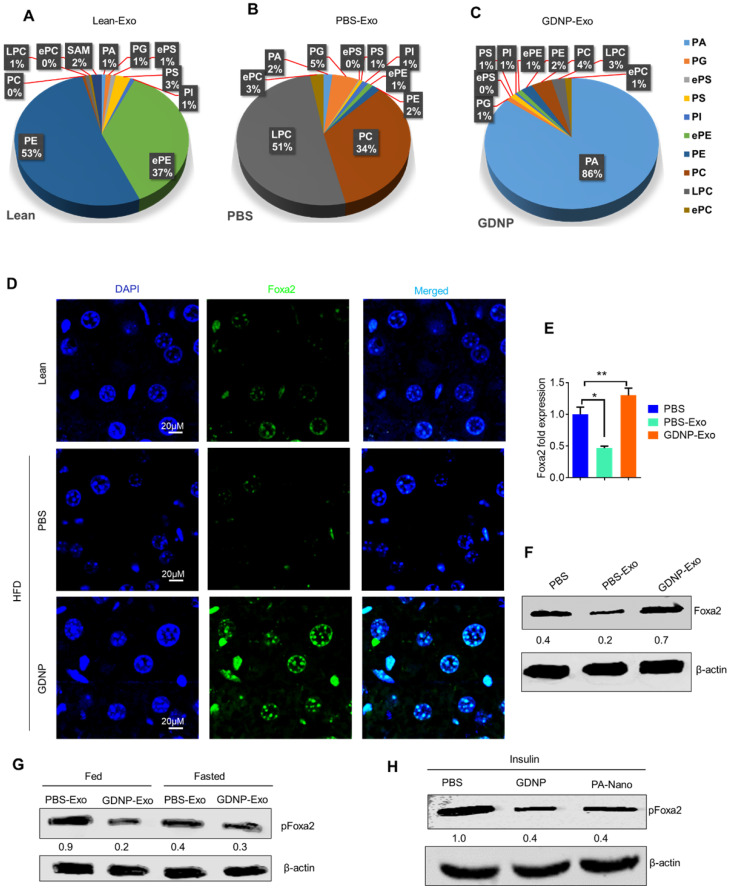
Figure 5.
GDNP treatment enhances the Foxa2 expression in liver. A. Pie graphs represents targeted lipidomics analysis of phospholipids in IEC exosomes derived from lean mice after 12 months at RCD (n =5/group). B. Pie graphs represents targeted lipidomics analysis of phospholipids in IEC exosomes derived from HFD-fed mice receiving PBS for 12 months (n =5/group). C. Pie graphs represents targeted lipidomics analysis of phospholipids in IEC exosomes derived from HFD-fed mice receiving GDNP for 12 months (n =5/group). D. Confocal images represent Foxa2 expression in liver sections from lean mice and HFD-fed mice receiving PBS or GDNP for 12 months (n =5/group). E. qPCR for Foxa2 mRNA expression in primary hepatocytes cultured with exosomes for 16 hours. Data represented from three independent experiments. F. Western blots for Foxa2 protein in primary hepatocytes cultured with exosomes for 16 hours. Ratio to β-actin shown in the middle (numbers). Data represented from three independent experiments. G. Western blots for pFoxa2 protein in primary hepatocytes cultured with exosomes derived from HFD-fed mice for 16 hours in fed and fasted condition. The ratio to β-actin shown in the middle (numbers). H. Western blots for pFoxa2 protein in primary hepatocytes cultured with GDNP and nanoparticles made up from phosphatic acid (PA-Nano) for 16 hours in the presence of insulin (50 nm). The ratio to β-actin shown in the middle (numbers). One-way ANOVA with the Bonferroni correction for multiple comparisons was used to calculate statistical significance (p value *<0.05; **<0.01).

