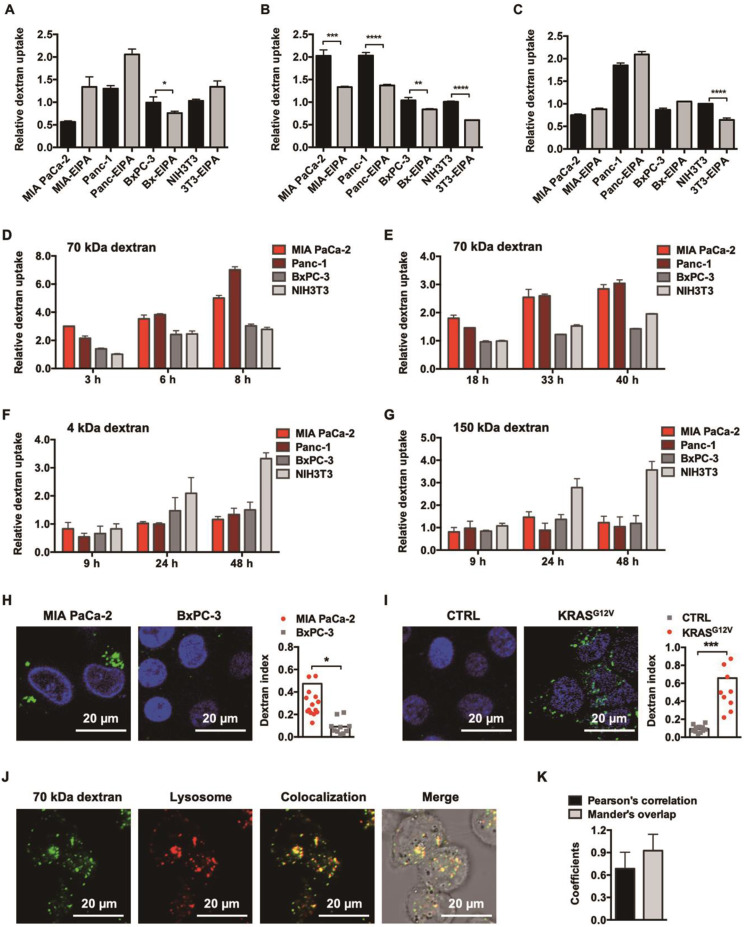
Figure 1.
KRAS-responsive cell entry of 70 kDa dextran. (A, B and C) Comparison of 4 kDa (A), 70 kDa (B), and 150 kDa (C) dextran uptake with (gray) or without (black) 50 μM EIPA in multiple cell lines. Data are presented relative to the values obtained for NIH3T3 cells. Error bars indicate the mean and SD, n=3. (D, E, F and G) Comparison of 1.0 mg/ml 70 kDa (D), 0.1 mg/ml 70 kDa (E), 4 kDa (F), and 150 kDa (F) dextran uptake between KRAS mutant (reddish) and KRAS wild-type (grayish) cells by flow cytometry at different time points. Data are presented relative to the values obtained for NIH3T3 cells at the first time point. Error bars indicate the mean and SD, n=3. (H and I) CLSM-aided confirmation of the enhanced entry of 70 kDa dextran (green) towards KRAS mutant cells. Representative images and quantifications are presented: MIA PaCa-2 compared to BxPC-3 (H) and BxPC-3 (CTRL) compared to BxPC-3 KRASG12V (KRASG12V) (I). (J) Lysosomal trafficking of 70 kDa dextran. Fluorescent signals: 70 kDa dextran (green), LysoTracker (red), colocalization of dextran and LysoTracker (yellow). (K) Pearson's correlation and Mander's overlap coefficients of the colocalization of 70 kDa dextran and LysoTracker. Error bars indicate the mean and SD, where at least 10 objects were observed.

