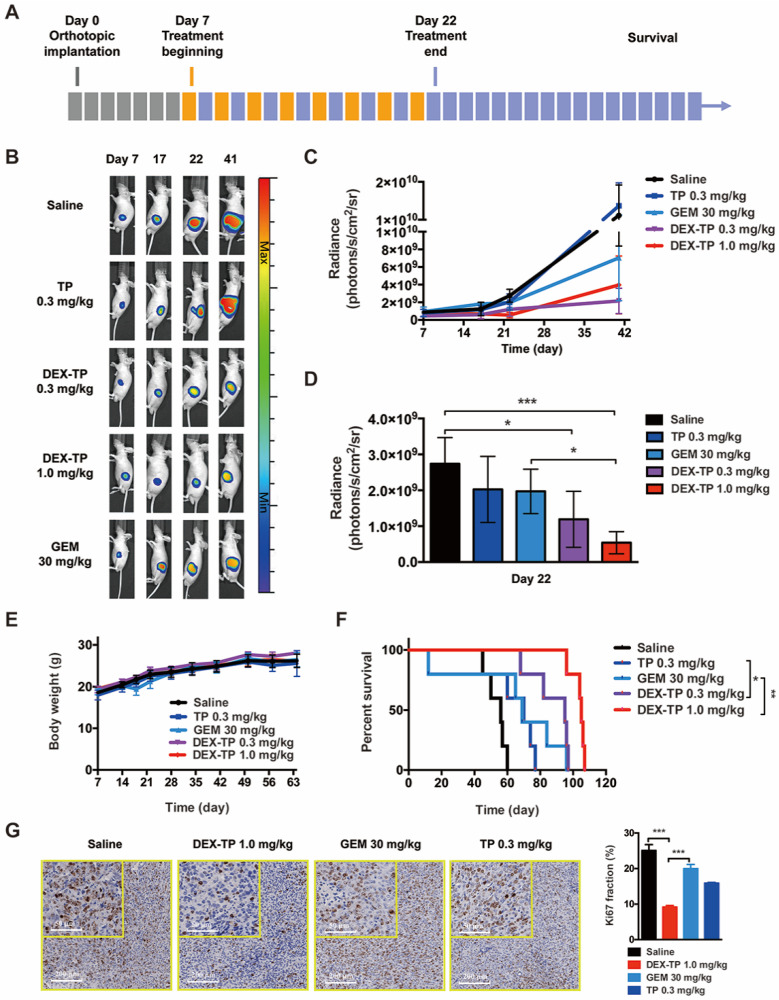
Figure 4.
DEX-TP restrained orthotopic MIA PaCa-2 tumor growth. (A) Scheme of experiment. Treatments were given every two days for a total of 8 treatments via tail vein injection, with n=5 for all groups. Doses are denoted in the figure, while DEX-TP is indicated as the equivalent dose of TP. (B) Representative bioluminescence images of anesthetized mice from al treatment groups before (day 7, left) during (day 17, middle left), immediately after 8 doses (day 22, middle right) and 20 days after dosing (day 41, right). (C) Overview of the orthotopic tumor growth curve from the qualitative analysis of all luminescence images. Error bars indicate the mean and SD. (D) Qualitative analysis of the luminescence intensity at day 22, when the dosing ended. Error bars indicate the mean and SD. (E) Body weight surveillance during experiments. Error bars indicate the mean and SD. (F) Kaplan-Meier survival curves of orthotopic MIA PaCa-2 tumor-bearing mice. (G) Ki67 analysis of tumor sections from each treatment group. Representative staining pictures (left) and quantification (right). Error bars indicate the mean and SD, n=3.

