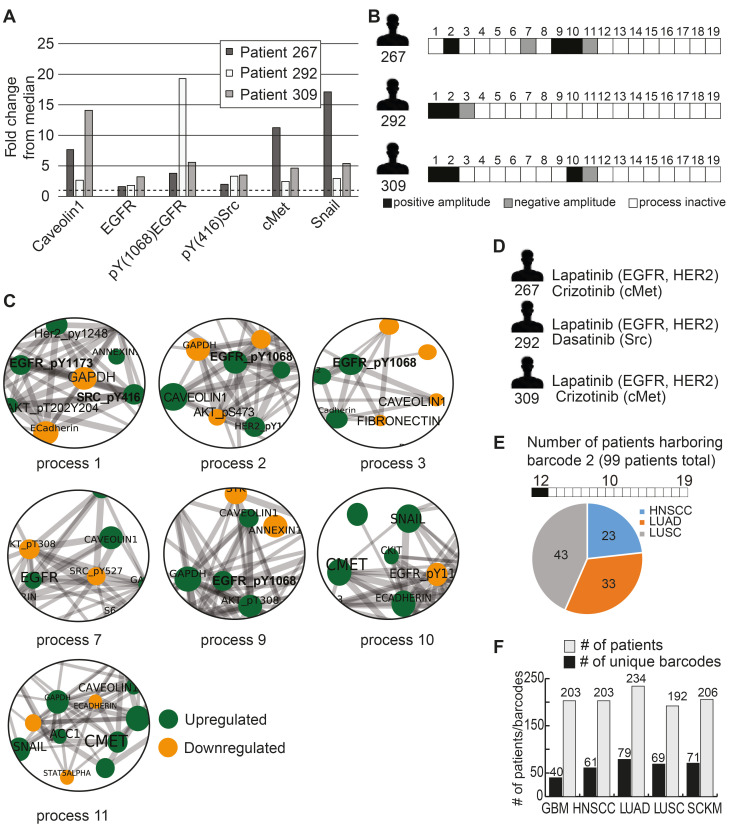
Figure 2.
Different patients with similar biomarker expression levels may harbor biologically distinct tumors. (A) Three HNSCC patients were selected to demonstrate this point: patient 267, patient 292 and patient 309. The expression levels of 6 HNSCC-related protein biomarkers were examined, showing that in all three patients these biomarkers were upregulated relative to their median values. The dashed line in the graph marks the x = 1 level. (B) However, PaSSS analysis revealed that these patients have different barcodes as they harbor different sets of unbalanced processes. (C) Zoom in images of the unbalanced processes 1,2,3,7,9,10 and 11, which characterize patients 267, 292 and 309, and the participation of the 6 HNSCC-related biomarkers in those processes, are presented. To determine the direction of change in every protein (i.e. upregulation or downregulation due to the process) the amplitudes of the processes in these patients were considered. Note that in other patients the directions of change may be opposite. See Methods for more details. The complete set of unbalanced processes is presented in Figure S2. (D) Drug combination prediction for patients 267, 292 and 309 based on their unbalanced processes. (E) 99 patients out of 1038 were found to harbor barcode 2, in which processes 1 and 2 are active. These 99 patients encompass 23 HNSCC patients, 33 LUAD patients, and 43 LUSC patients. (F) The graph represents the uniquely characterized tumors along with the total number of patients in each cancer type; e.g. 61 barcodes, representing different altered signaling signatures, were identified in 203 HNSCC patients.

