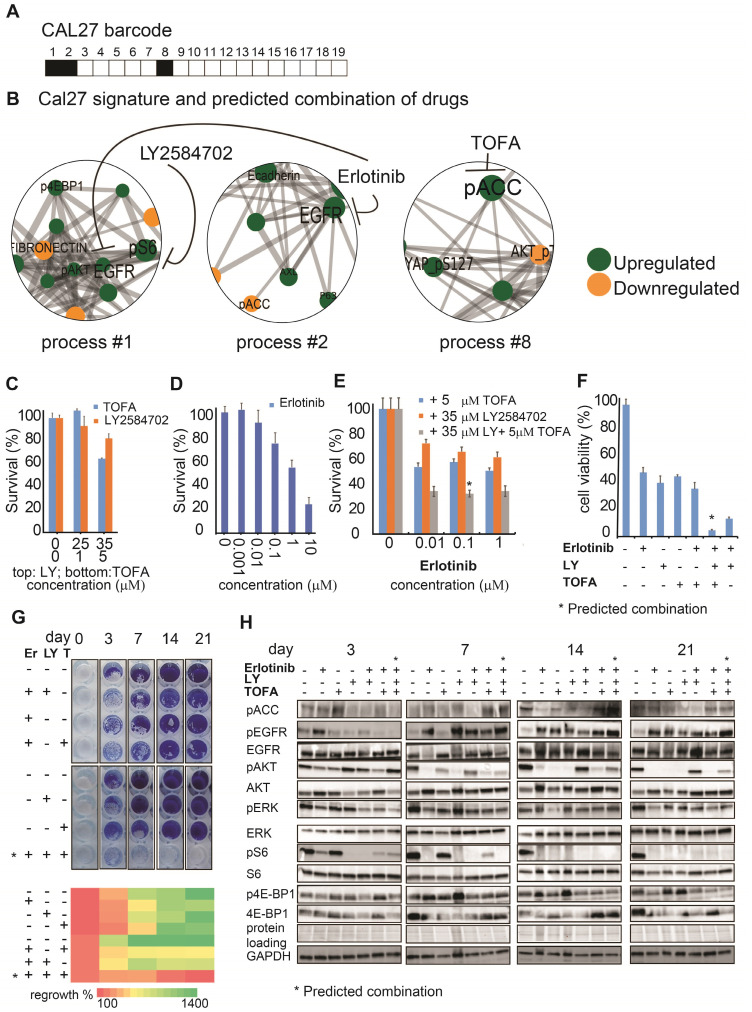
Figure 4.
The SA-based calculation of PaSSS allowed designing the efficient drug combinations for Cal27. (A, B) Barcode, depicting the unbalanced processes and its emerging altered signaling signature in Cal27 cells, according to PaSSS analysis. Zoom-in images of the unbalanced processes active in Cal27 cells are shown (Figure S4 shows all participating proteins in each process). Correspondingly, the upregulation or downregulation of every protein is indicated in green or yellow, respectively. The predicted drug combination and the processes each drug targets are shown (B). (C, D, E) Survival of Cal27 in response to different treatments and dosages. The combination of drugs predicted to target the unbalanced signaling signature (marked with an asterisk), as well as combinations that were predicted to partially target the unbalanced signaling flux of Cal27, were tested. (F) MTT assay confirms further the efficiency of the predicted drug combination (erlotinib, LY2584702 and TOFA). The predicted drug combination for Cal27 depletes the signaling flux and prevents cell regrowth. (G, upper panel) Cells were treated every three days and regrowth was measured up to 21 days with either monotherapy (erlotinib 0.1μM (Er), LY2584702 (LY) 35μM, TOFA (T) 5μM), with the predicted drug combination (marked with an asterisk) or with the combinations that were predicted to partially target the unbalanced signaling flux of Cal27. Representative methylene blue-stained cell cultures are shown. (G, lower panel) Regrowth was quantified and presented as a heatmap. Day 0 represents the amount of cells seeded at the same day and was defined as 100%. Fold change relative to the amount of cells at day 0 is presented. Green color indicates higher regrowth levels (> 100%) and red shows decrease or depletion of the cells (< 100%). (H) Western blot analysis of the treated cells at different time points. The predicted drug combination is marked with an asterisk (*).

