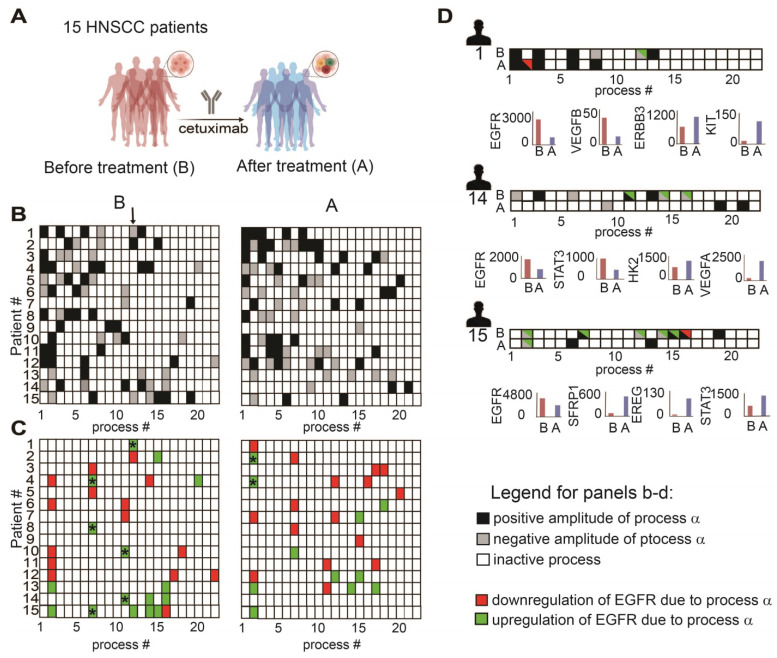
Figure 6.
Anti-EGFR monotherapy fails to reduce the unbalanced flux in HNSCC human samples. (A) Changes in gene expression levels were acquired from 15 HNSCC patients before and after treatment with cetuximab for 2 weeks as shown in the illustration. (B) Patient-specific barcodes were generated for each patient before (left panel) and after the treatment (right panel). Negative/positive amplitude denotes how the patients are correlated with respect to a particular process. For example, patient 1 harbors process 12- (labeled with a black arrow), whereas patient 2 harbors process 12+. Therefore, transcripts that participate in process 12 (Table S9) deviate from the steady state in opposite directions in these patients. (C) Only processes in which EGFR participates are shown for each patient. EGFR upregulation or downregulation due to the process were defined as explained in the Figure legend of Figure S2 and labeled with green (upregulation due to a process) or red (downregulation due to a process) colors. In certain tumors, in which a clear reduction in the levels of EGFR and EGFR-related transcripts was detected, other onco-transcripts were upregulated. (D) Patient-specific barcodes are shown for patients #1,14,15. EGFR participation in active processes is labeled with green and red colors as indicated. Examples for a change in the experimental gene expression levels in response to EGFR inhibition are shown for selected genes and for each patient in lower panels. (B -barcodes before the treatment; A - after the treatment). Panel (A) was created using BioRender.com.

