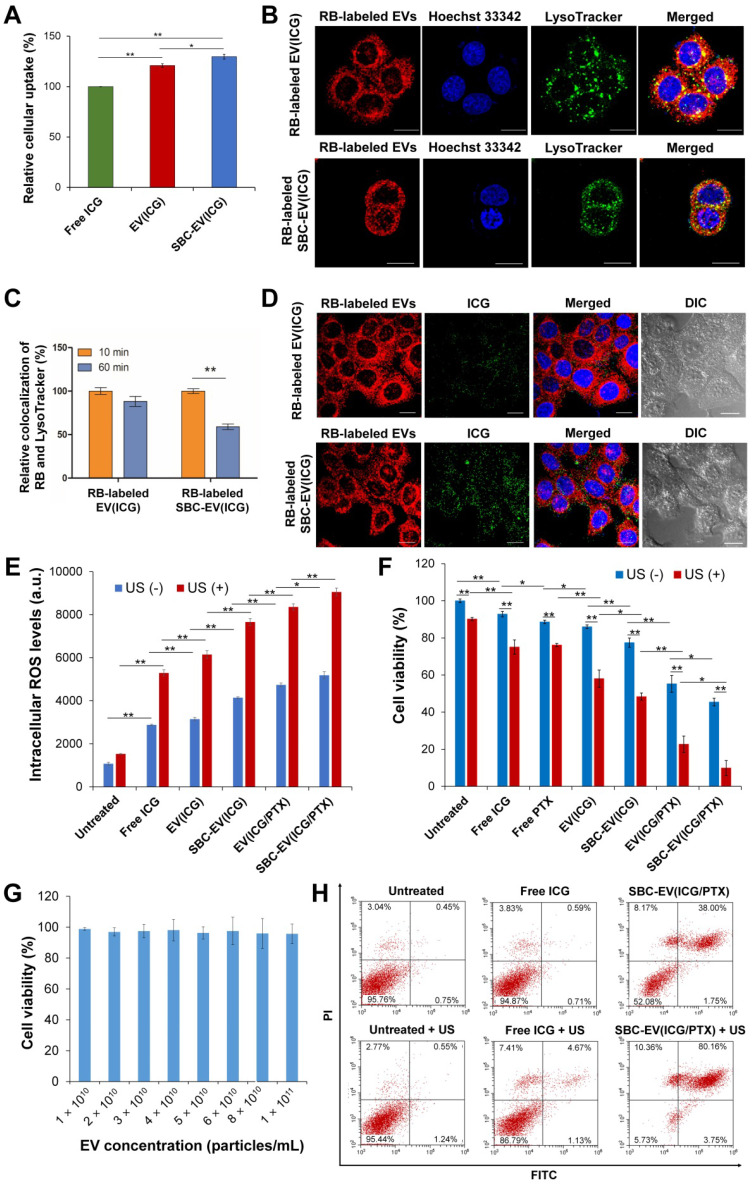
Figure 3.
(A) Relative internalization of ICG by MCF-7 cells after 4 h of treatment with free ICG, EV(ICG), and SBC-EV(ICG). (B) Live confocal microscopic images of MCF-7 cells treated with RB-labeled EV(ICG) and RB-labeled SBC-EV(ICG). LysoTracker (green dots) was used to stain endo/lysosomal compartments. Hoechst 33342 (blue dots) was used to stain cellular nuclei. Scale bar = 20 µm. (C) Relative colocalization ratios of RB with LysoTracker in MCF-7 cells after incubation with RB-labeled EV(ICG) and RB-labeled SBC-EV(ICG) for different incubation times. (D) Intracellular distribution of RB-labeled EVs (red dots) and ICG (green dots) in live MCF-7 cells, observed by confocal laser scanning microscopy. The cells were treated with RB-labeled EV(ICG) and RB-labeled SBC-EV(ICG) for 1 h. Differential interference contrast images show the cell morphology throughout the imaging process. Scale bar = 20 µm. (E) Intracellular ROS levels in MCF-7 cells treated with free ICG and ICG-loaded EV samples before and after US treatment. (F) Viabilities of MCF-7 cells after treatment with various EV samples before and after US irradiation (0.3 W/cm2 for 1 min). (G) Viabilities of MCF-7 cells treated with blank EVs at varying concentrations. Data were represented as mean ± SD (*p < 0.05, **p < 0.01, n = 3). (H) Apoptosis analysis of MCF-7 cells treated with free ICG and SBC-EV(ICG/PTX) before and after US treatment.

