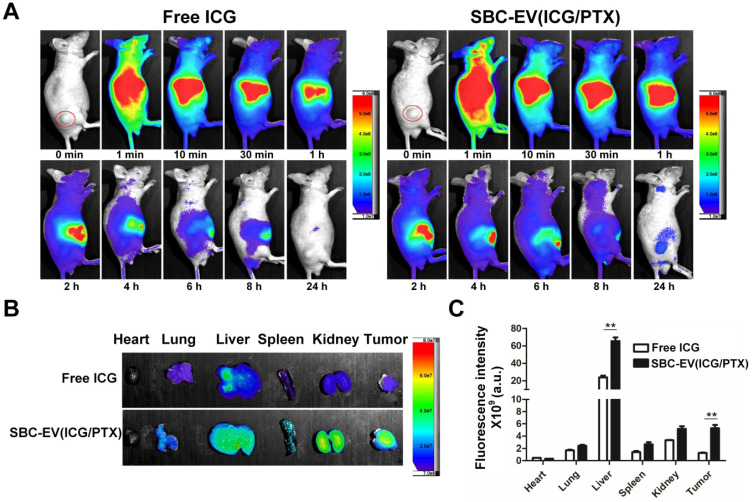
Figure 4.
(A) In vivo biodistribution images from tumor-xenograft mice after i.v. administration of free ICG and SBC-EV(ICG/PTX). (B) Ex vivo imaging of tumors and major organs at 24 h-post injection of free ICG and SBC-EV(ICG/PTX). (C) Quantification of ICG from ex vivo imaging of major organs at 24 h-post i.v. administration of free ICG and SBC-EV(ICG/PTX) (**p < 0.01, n = 4).

