
FIG 1.
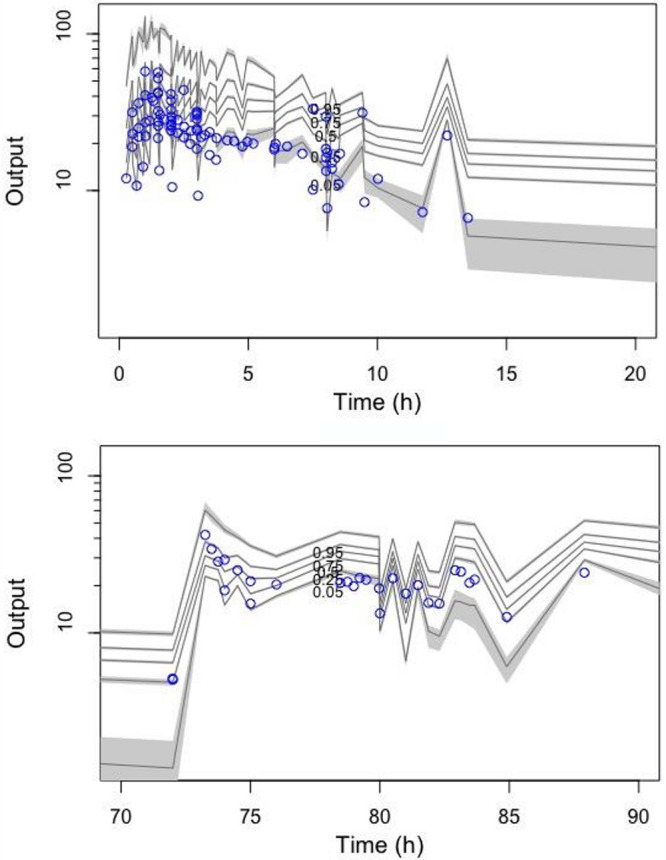
Visual Predictive Check for patients with trough concentrations (top) and patients without trough concentrations (bottom). n = 1,000 simulations of vancomycin plasma concentration data (open circles represent observed data and the lines represent the 5th, 25th, 50th, 75th, and 95% percentiles based on simulations of the pharmacokinetic model).