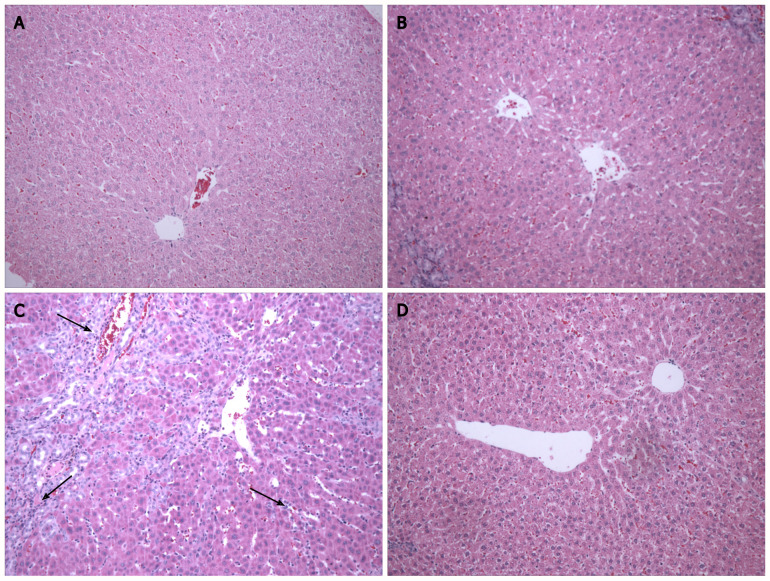
Figure 1.
Photomicrograph of hepatic tissue at 200 × magnification in the different experimental groups. The control (CO) and CO + melatonin (MLT) groups had normal liver parenchyma. There was inflammatory infiltrate (black arrows) and a change in the parenchyma in the bile duct ligation (BDL) group. Parenchymal restructuring occurred in the BDL + MLT group. A: CO; B: CO + MLT; C: BDL; D: BDL + MLT.

